Immigrants from Denmark vs Immigrants from Laos Poverty
COMPARE
Immigrants from Denmark
Immigrants from Laos
Poverty
Poverty Comparison
Immigrants from Denmark
Immigrants from Laos
11.4%
POVERTY
95.5/ 100
METRIC RATING
90th/ 347
METRIC RANK
13.8%
POVERTY
0.7/ 100
METRIC RATING
234th/ 347
METRIC RANK
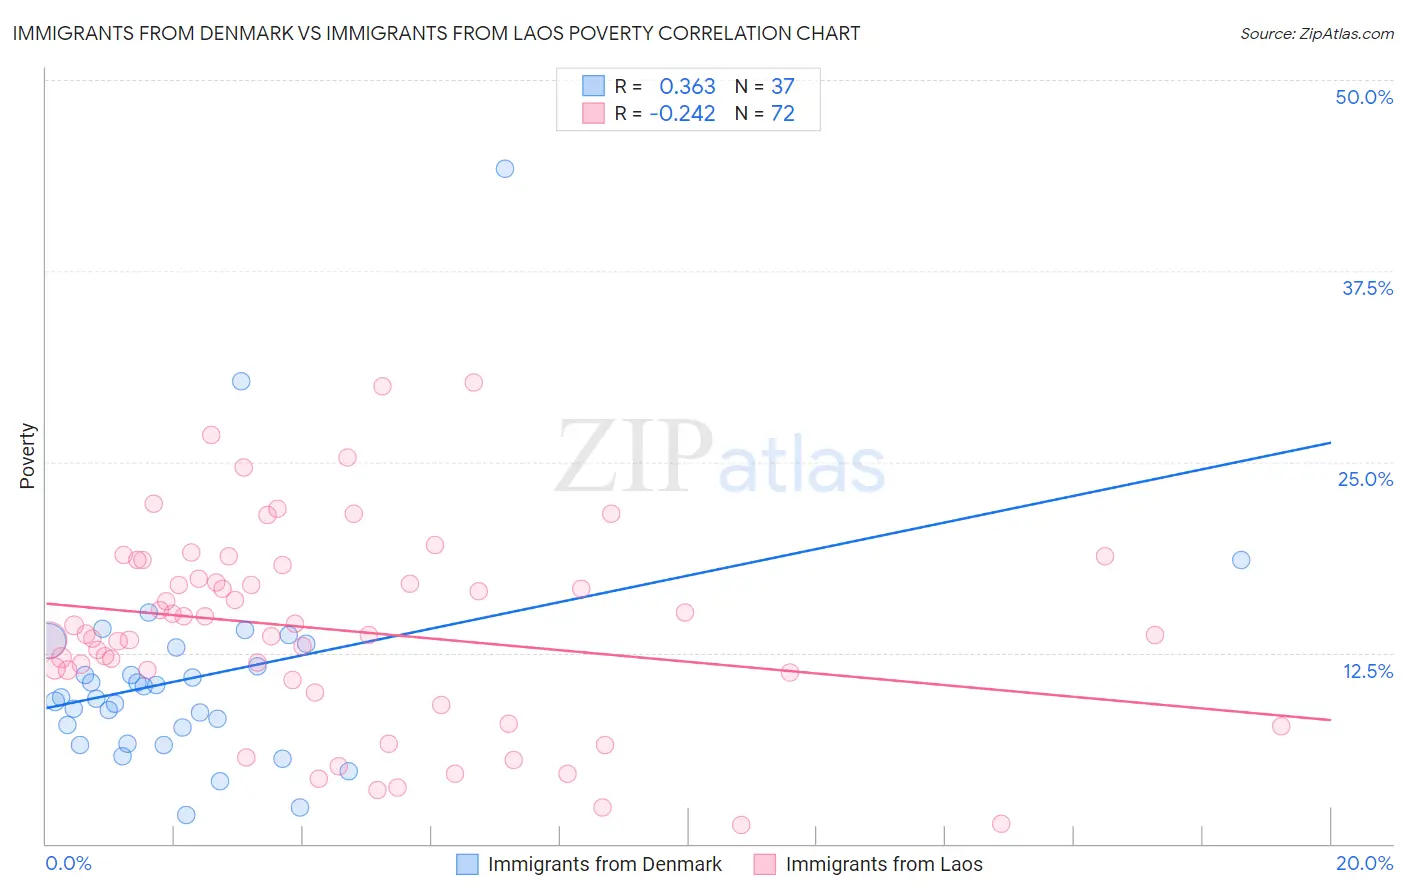
Immigrants from Denmark vs Immigrants from Laos Poverty Correlation Chart
The statistical analysis conducted on geographies consisting of 136,404,120 people shows a mild positive correlation between the proportion of Immigrants from Denmark and poverty level in the United States with a correlation coefficient (R) of 0.363 and weighted average of 11.4%. Similarly, the statistical analysis conducted on geographies consisting of 201,466,628 people shows a weak negative correlation between the proportion of Immigrants from Laos and poverty level in the United States with a correlation coefficient (R) of -0.242 and weighted average of 13.8%, a difference of 21.0%.
Poverty Correlation Summary
| Measurement | Immigrants from Denmark | Immigrants from Laos |
| Minimum | 1.9% | 1.2% |
| Maximum | 44.2% | 30.2% |
| Range | 42.3% | 29.0% |
| Mean | 11.0% | 14.0% |
| Median | 9.6% | 13.7% |
| Interquartile 25% (IQ1) | 7.1% | 11.0% |
| Interquartile 75% (IQ3) | 13.0% | 17.8% |
| Interquartile Range (IQR) | 5.9% | 6.8% |
| Standard Deviation (Sample) | 7.5% | 6.5% |
| Standard Deviation (Population) | 7.4% | 6.4% |
Similar Demographics by Poverty
Demographics Similar to Immigrants from Denmark by Poverty
In terms of poverty, the demographic groups most similar to Immigrants from Denmark are Finnish (11.4%, a difference of 0.13%), Czechoslovakian (11.4%, a difference of 0.17%), Belgian (11.4%, a difference of 0.20%), British (11.4%, a difference of 0.27%), and Romanian (11.4%, a difference of 0.31%).
| Demographics | Rating | Rank | Poverty |
| Immigrants | Sweden | 96.3 /100 | #83 | Exceptional 11.3% |
| English | 96.3 /100 | #84 | Exceptional 11.3% |
| Immigrants | England | 96.2 /100 | #85 | Exceptional 11.4% |
| Jordanians | 96.0 /100 | #86 | Exceptional 11.4% |
| Northern Europeans | 96.0 /100 | #87 | Exceptional 11.4% |
| Belgians | 95.8 /100 | #88 | Exceptional 11.4% |
| Czechoslovakians | 95.7 /100 | #89 | Exceptional 11.4% |
| Immigrants | Denmark | 95.5 /100 | #90 | Exceptional 11.4% |
| Finns | 95.2 /100 | #91 | Exceptional 11.4% |
| British | 95.0 /100 | #92 | Exceptional 11.4% |
| Romanians | 94.9 /100 | #93 | Exceptional 11.4% |
| Paraguayans | 94.9 /100 | #94 | Exceptional 11.4% |
| Australians | 94.9 /100 | #95 | Exceptional 11.4% |
| Immigrants | South Africa | 94.7 /100 | #96 | Exceptional 11.5% |
| Immigrants | Egypt | 94.6 /100 | #97 | Exceptional 11.5% |
Demographics Similar to Immigrants from Laos by Poverty
In terms of poverty, the demographic groups most similar to Immigrants from Laos are Immigrants from Saudi Arabia (13.8%, a difference of 0.24%), Cuban (13.9%, a difference of 0.44%), Immigrants from Armenia (13.9%, a difference of 0.47%), Fijian (13.7%, a difference of 0.49%), and French American Indian (13.9%, a difference of 0.49%).
| Demographics | Rating | Rank | Poverty |
| Alaska Natives | 2.1 /100 | #227 | Tragic 13.5% |
| Immigrants | Nigeria | 1.7 /100 | #228 | Tragic 13.5% |
| Osage | 1.5 /100 | #229 | Tragic 13.6% |
| Alaskan Athabascans | 1.5 /100 | #230 | Tragic 13.6% |
| Nigerians | 1.4 /100 | #231 | Tragic 13.6% |
| Fijians | 0.8 /100 | #232 | Tragic 13.7% |
| Immigrants | Saudi Arabia | 0.8 /100 | #233 | Tragic 13.8% |
| Immigrants | Laos | 0.7 /100 | #234 | Tragic 13.8% |
| Cubans | 0.6 /100 | #235 | Tragic 13.9% |
| Immigrants | Armenia | 0.5 /100 | #236 | Tragic 13.9% |
| French American Indians | 0.5 /100 | #237 | Tragic 13.9% |
| Ghanaians | 0.5 /100 | #238 | Tragic 13.9% |
| Nicaraguans | 0.4 /100 | #239 | Tragic 13.9% |
| Immigrants | Middle Africa | 0.4 /100 | #240 | Tragic 14.0% |
| Salvadorans | 0.4 /100 | #241 | Tragic 14.0% |