Immigrants from Cuba vs Ugandan Wage/Income Gap
COMPARE
Immigrants from Cuba
Ugandan
Wage/Income Gap
Wage/Income Gap Comparison
Immigrants from Cuba
Ugandans
22.4%
WAGE/INCOME GAP
100.0/ 100
METRIC RATING
58th/ 347
METRIC RANK
24.1%
WAGE/INCOME GAP
98.3/ 100
METRIC RATING
109th/ 347
METRIC RANK
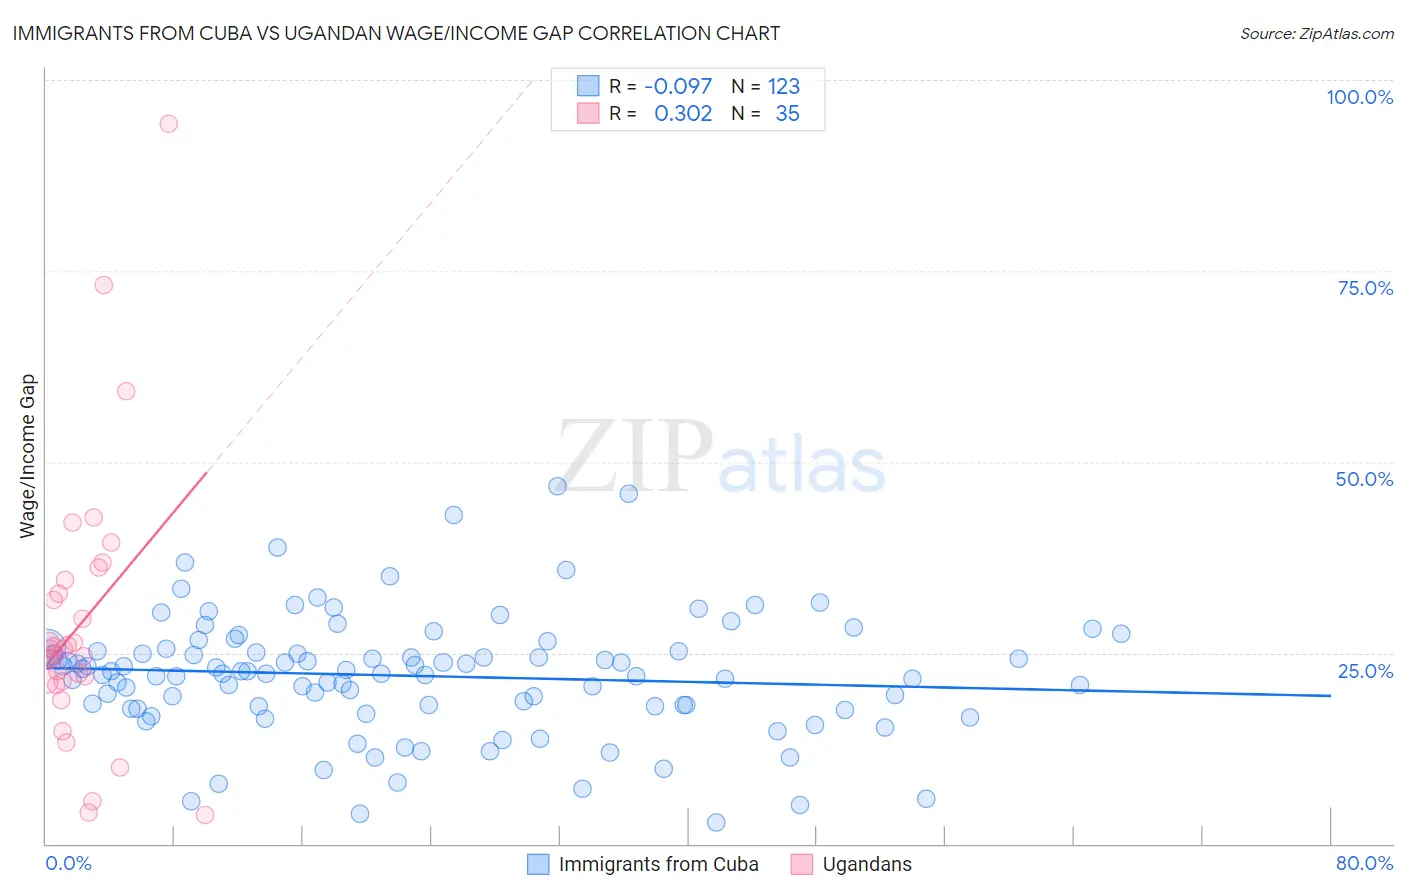
Immigrants from Cuba vs Ugandan Wage/Income Gap Correlation Chart
The statistical analysis conducted on geographies consisting of 325,829,876 people shows a slight negative correlation between the proportion of Immigrants from Cuba and wage/income gap percentage in the United States with a correlation coefficient (R) of -0.097 and weighted average of 22.4%. Similarly, the statistical analysis conducted on geographies consisting of 94,009,821 people shows a mild positive correlation between the proportion of Ugandans and wage/income gap percentage in the United States with a correlation coefficient (R) of 0.302 and weighted average of 24.1%, a difference of 7.6%.
Wage/Income Gap Correlation Summary
| Measurement | Immigrants from Cuba | Ugandan |
| Minimum | 2.8% | 3.7% |
| Maximum | 46.8% | 94.2% |
| Range | 44.0% | 90.5% |
| Mean | 22.0% | 28.8% |
| Median | 22.3% | 25.5% |
| Interquartile 25% (IQ1) | 18.0% | 21.3% |
| Interquartile 75% (IQ3) | 25.3% | 34.5% |
| Interquartile Range (IQR) | 7.3% | 13.3% |
| Standard Deviation (Sample) | 7.9% | 17.9% |
| Standard Deviation (Population) | 7.9% | 17.7% |
Similar Demographics by Wage/Income Gap
Demographics Similar to Immigrants from Cuba by Wage/Income Gap
In terms of wage/income gap, the demographic groups most similar to Immigrants from Cuba are Navajo (22.4%, a difference of 0.040%), Immigrants from Middle Africa (22.4%, a difference of 0.060%), Ghanaian (22.3%, a difference of 0.080%), Immigrants from Ghana (22.3%, a difference of 0.18%), and Immigrants from Zaire (22.3%, a difference of 0.22%).
| Demographics | Rating | Rank | Wage/Income Gap |
| Tohono O'odham | 100.0 /100 | #51 | Exceptional 22.1% |
| Immigrants | Cameroon | 100.0 /100 | #52 | Exceptional 22.2% |
| Bangladeshis | 100.0 /100 | #53 | Exceptional 22.2% |
| Nepalese | 100.0 /100 | #54 | Exceptional 22.2% |
| Immigrants | Zaire | 100.0 /100 | #55 | Exceptional 22.3% |
| Immigrants | Ghana | 100.0 /100 | #56 | Exceptional 22.3% |
| Ghanaians | 100.0 /100 | #57 | Exceptional 22.3% |
| Immigrants | Cuba | 100.0 /100 | #58 | Exceptional 22.4% |
| Navajo | 100.0 /100 | #59 | Exceptional 22.4% |
| Immigrants | Middle Africa | 100.0 /100 | #60 | Exceptional 22.4% |
| Immigrants | Fiji | 100.0 /100 | #61 | Exceptional 22.4% |
| Immigrants | Guatemala | 100.0 /100 | #62 | Exceptional 22.5% |
| Immigrants | Ecuador | 100.0 /100 | #63 | Exceptional 22.5% |
| Spanish American Indians | 100.0 /100 | #64 | Exceptional 22.5% |
| Guatemalans | 99.9 /100 | #65 | Exceptional 22.6% |
Demographics Similar to Ugandans by Wage/Income Gap
In terms of wage/income gap, the demographic groups most similar to Ugandans are Yaqui (24.0%, a difference of 0.060%), Immigrants from Albania (24.0%, a difference of 0.060%), Immigrants from Morocco (24.1%, a difference of 0.22%), Sudanese (24.0%, a difference of 0.36%), and Moroccan (24.0%, a difference of 0.37%).
| Demographics | Rating | Rank | Wage/Income Gap |
| Immigrants | Laos | 99.0 /100 | #102 | Exceptional 23.8% |
| Tsimshian | 98.9 /100 | #103 | Exceptional 23.9% |
| Tlingit-Haida | 98.7 /100 | #104 | Exceptional 24.0% |
| Moroccans | 98.6 /100 | #105 | Exceptional 24.0% |
| Sudanese | 98.6 /100 | #106 | Exceptional 24.0% |
| Yaqui | 98.4 /100 | #107 | Exceptional 24.0% |
| Immigrants | Albania | 98.4 /100 | #108 | Exceptional 24.0% |
| Ugandans | 98.3 /100 | #109 | Exceptional 24.1% |
| Immigrants | Morocco | 98.1 /100 | #110 | Exceptional 24.1% |
| Soviet Union | 97.6 /100 | #111 | Exceptional 24.2% |
| Immigrants | Colombia | 97.0 /100 | #112 | Exceptional 24.3% |
| Sioux | 96.9 /100 | #113 | Exceptional 24.3% |
| Panamanians | 96.5 /100 | #114 | Exceptional 24.4% |
| Immigrants | Kenya | 96.4 /100 | #115 | Exceptional 24.4% |
| Alaska Natives | 96.0 /100 | #116 | Exceptional 24.4% |