Immigrants from Congo vs Latvian Wage/Income Gap
COMPARE
Immigrants from Congo
Latvian
Wage/Income Gap
Wage/Income Gap Comparison
Immigrants from Congo
Latvians
21.7%
WAGE/INCOME GAP
100.0/ 100
METRIC RATING
47th/ 347
METRIC RANK
27.9%
WAGE/INCOME GAP
0.7/ 100
METRIC RATING
277th/ 347
METRIC RANK
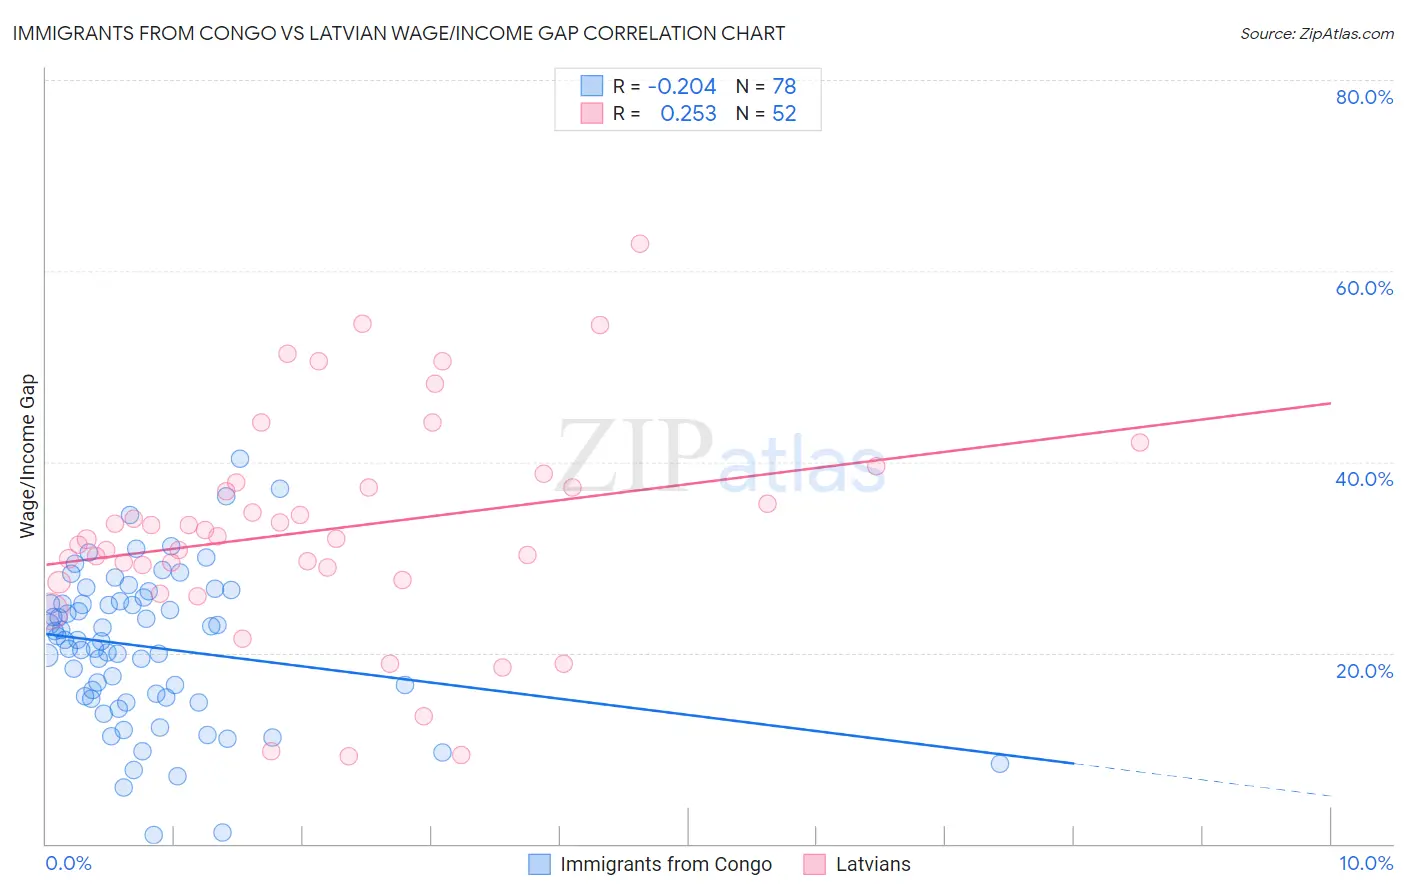
Immigrants from Congo vs Latvian Wage/Income Gap Correlation Chart
The statistical analysis conducted on geographies consisting of 92,125,564 people shows a weak negative correlation between the proportion of Immigrants from Congo and wage/income gap percentage in the United States with a correlation coefficient (R) of -0.204 and weighted average of 21.7%. Similarly, the statistical analysis conducted on geographies consisting of 220,666,647 people shows a weak positive correlation between the proportion of Latvians and wage/income gap percentage in the United States with a correlation coefficient (R) of 0.253 and weighted average of 27.9%, a difference of 28.5%.
Wage/Income Gap Correlation Summary
| Measurement | Immigrants from Congo | Latvian |
| Minimum | 0.90% | 9.2% |
| Maximum | 40.3% | 62.8% |
| Range | 39.4% | 53.6% |
| Mean | 20.6% | 32.9% |
| Median | 21.3% | 32.1% |
| Interquartile 25% (IQ1) | 15.4% | 28.3% |
| Interquartile 75% (IQ3) | 25.4% | 37.6% |
| Interquartile Range (IQR) | 10.0% | 9.3% |
| Standard Deviation (Sample) | 7.9% | 11.4% |
| Standard Deviation (Population) | 7.9% | 11.3% |
Similar Demographics by Wage/Income Gap
Demographics Similar to Immigrants from Congo by Wage/Income Gap
In terms of wage/income gap, the demographic groups most similar to Immigrants from Congo are Black/African American (21.7%, a difference of 0.18%), Immigrants from Ethiopia (21.6%, a difference of 0.55%), U.S. Virgin Islander (21.5%, a difference of 0.67%), Ethiopian (21.8%, a difference of 0.69%), and Immigrants from Eritrea (21.4%, a difference of 1.1%).
| Demographics | Rating | Rank | Wage/Income Gap |
| Lumbee | 100.0 /100 | #40 | Exceptional 21.3% |
| Liberians | 100.0 /100 | #41 | Exceptional 21.4% |
| Immigrants | Sierra Leone | 100.0 /100 | #42 | Exceptional 21.4% |
| Sierra Leoneans | 100.0 /100 | #43 | Exceptional 21.4% |
| Immigrants | Eritrea | 100.0 /100 | #44 | Exceptional 21.4% |
| U.S. Virgin Islanders | 100.0 /100 | #45 | Exceptional 21.5% |
| Immigrants | Ethiopia | 100.0 /100 | #46 | Exceptional 21.6% |
| Immigrants | Congo | 100.0 /100 | #47 | Exceptional 21.7% |
| Blacks/African Americans | 100.0 /100 | #48 | Exceptional 21.7% |
| Ethiopians | 100.0 /100 | #49 | Exceptional 21.8% |
| Immigrants | Western Africa | 100.0 /100 | #50 | Exceptional 22.0% |
| Tohono O'odham | 100.0 /100 | #51 | Exceptional 22.1% |
| Immigrants | Cameroon | 100.0 /100 | #52 | Exceptional 22.2% |
| Bangladeshis | 100.0 /100 | #53 | Exceptional 22.2% |
| Nepalese | 100.0 /100 | #54 | Exceptional 22.2% |
Demographics Similar to Latvians by Wage/Income Gap
In terms of wage/income gap, the demographic groups most similar to Latvians are Lebanese (27.9%, a difference of 0.0%), Immigrants from Japan (27.9%, a difference of 0.030%), Immigrants from England (27.9%, a difference of 0.080%), American (27.8%, a difference of 0.11%), and Bulgarian (27.8%, a difference of 0.15%).
| Demographics | Rating | Rank | Wage/Income Gap |
| Immigrants | Western Europe | 0.9 /100 | #270 | Tragic 27.8% |
| Ute | 0.8 /100 | #271 | Tragic 27.8% |
| Immigrants | Korea | 0.8 /100 | #272 | Tragic 27.8% |
| Bulgarians | 0.7 /100 | #273 | Tragic 27.8% |
| Americans | 0.7 /100 | #274 | Tragic 27.8% |
| Immigrants | Japan | 0.7 /100 | #275 | Tragic 27.9% |
| Lebanese | 0.7 /100 | #276 | Tragic 27.9% |
| Latvians | 0.7 /100 | #277 | Tragic 27.9% |
| Immigrants | England | 0.6 /100 | #278 | Tragic 27.9% |
| Romanians | 0.5 /100 | #279 | Tragic 28.0% |
| Russians | 0.5 /100 | #280 | Tragic 28.0% |
| Burmese | 0.5 /100 | #281 | Tragic 28.0% |
| South Africans | 0.5 /100 | #282 | Tragic 28.0% |
| French Canadians | 0.4 /100 | #283 | Tragic 28.1% |
| Immigrants | Sweden | 0.4 /100 | #284 | Tragic 28.1% |