Immigrants from Congo vs Latvian Unemployment Among Ages 55 to 59 years
COMPARE
Immigrants from Congo
Latvian
Unemployment Among Ages 55 to 59 years
Unemployment Among Ages 55 to 59 years Comparison
Immigrants from Congo
Latvians
4.3%
UNEMPLOYMENT AMONG AGES 55 TO 59 YEARS
100.0/ 100
METRIC RATING
11th/ 347
METRIC RANK
4.6%
UNEMPLOYMENT AMONG AGES 55 TO 59 YEARS
97.8/ 100
METRIC RATING
82nd/ 347
METRIC RANK
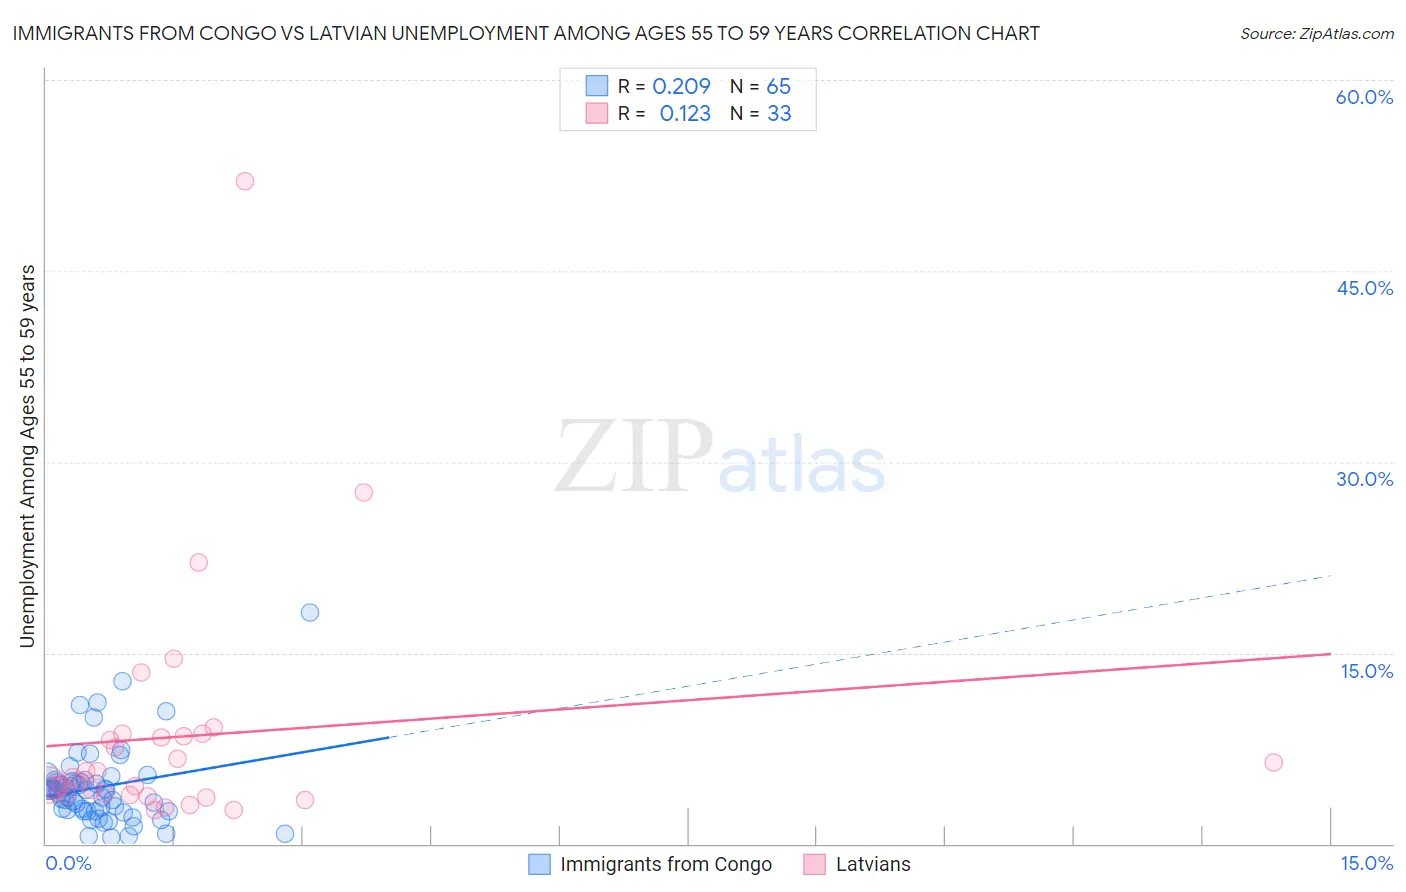
Immigrants from Congo vs Latvian Unemployment Among Ages 55 to 59 years Correlation Chart
The statistical analysis conducted on geographies consisting of 90,603,220 people shows a weak positive correlation between the proportion of Immigrants from Congo and unemployment rate among population between the ages 55 and 59 in the United States with a correlation coefficient (R) of 0.209 and weighted average of 4.3%. Similarly, the statistical analysis conducted on geographies consisting of 211,251,684 people shows a poor positive correlation between the proportion of Latvians and unemployment rate among population between the ages 55 and 59 in the United States with a correlation coefficient (R) of 0.123 and weighted average of 4.6%, a difference of 7.6%.
Unemployment Among Ages 55 to 59 years Correlation Summary
| Measurement | Immigrants from Congo | Latvian |
| Minimum | 0.50% | 2.7% |
| Maximum | 18.2% | 52.1% |
| Range | 17.7% | 49.4% |
| Mean | 4.4% | 8.4% |
| Median | 4.2% | 5.2% |
| Interquartile 25% (IQ1) | 2.6% | 3.8% |
| Interquartile 75% (IQ3) | 5.0% | 8.5% |
| Interquartile Range (IQR) | 2.4% | 4.8% |
| Standard Deviation (Sample) | 3.1% | 9.5% |
| Standard Deviation (Population) | 3.1% | 9.4% |
Similar Demographics by Unemployment Among Ages 55 to 59 years
Demographics Similar to Immigrants from Congo by Unemployment Among Ages 55 to 59 years
In terms of unemployment among ages 55 to 59 years, the demographic groups most similar to Immigrants from Congo are Danish (4.3%, a difference of 0.19%), Indonesian (4.3%, a difference of 0.45%), Tongan (4.3%, a difference of 0.51%), Immigrants from India (4.3%, a difference of 0.61%), and Bulgarian (4.3%, a difference of 0.87%).
| Demographics | Rating | Rank | Unemployment Among Ages 55 to 59 years |
| Venezuelans | 100.0 /100 | #4 | Exceptional 4.2% |
| Immigrants | Bolivia | 100.0 /100 | #5 | Exceptional 4.2% |
| Norwegians | 100.0 /100 | #6 | Exceptional 4.2% |
| Zimbabweans | 100.0 /100 | #7 | Exceptional 4.2% |
| Bolivians | 100.0 /100 | #8 | Exceptional 4.2% |
| Cubans | 100.0 /100 | #9 | Exceptional 4.2% |
| Tongans | 100.0 /100 | #10 | Exceptional 4.3% |
| Immigrants | Congo | 100.0 /100 | #11 | Exceptional 4.3% |
| Danes | 100.0 /100 | #12 | Exceptional 4.3% |
| Indonesians | 100.0 /100 | #13 | Exceptional 4.3% |
| Immigrants | India | 100.0 /100 | #14 | Exceptional 4.3% |
| Bulgarians | 100.0 /100 | #15 | Exceptional 4.3% |
| Somalis | 100.0 /100 | #16 | Exceptional 4.4% |
| Czechs | 100.0 /100 | #17 | Exceptional 4.4% |
| Immigrants | Somalia | 100.0 /100 | #18 | Exceptional 4.4% |
Demographics Similar to Latvians by Unemployment Among Ages 55 to 59 years
In terms of unemployment among ages 55 to 59 years, the demographic groups most similar to Latvians are Taiwanese (4.6%, a difference of 0.050%), Cambodian (4.6%, a difference of 0.12%), Lebanese (4.6%, a difference of 0.12%), Sri Lankan (4.6%, a difference of 0.16%), and Finnish (4.6%, a difference of 0.25%).
| Demographics | Rating | Rank | Unemployment Among Ages 55 to 59 years |
| Immigrants | Iraq | 98.5 /100 | #75 | Exceptional 4.6% |
| Immigrants | Bosnia and Herzegovina | 98.3 /100 | #76 | Exceptional 4.6% |
| Scotch-Irish | 98.3 /100 | #77 | Exceptional 4.6% |
| Finns | 98.2 /100 | #78 | Exceptional 4.6% |
| Sri Lankans | 98.1 /100 | #79 | Exceptional 4.6% |
| Cambodians | 98.0 /100 | #80 | Exceptional 4.6% |
| Taiwanese | 97.9 /100 | #81 | Exceptional 4.6% |
| Latvians | 97.8 /100 | #82 | Exceptional 4.6% |
| Lebanese | 97.5 /100 | #83 | Exceptional 4.6% |
| Malaysians | 96.9 /100 | #84 | Exceptional 4.7% |
| Immigrants | Vietnam | 96.9 /100 | #85 | Exceptional 4.7% |
| Immigrants | Colombia | 96.9 /100 | #86 | Exceptional 4.7% |
| Poles | 96.9 /100 | #87 | Exceptional 4.7% |
| Immigrants | Cameroon | 96.9 /100 | #88 | Exceptional 4.7% |
| Irish | 96.8 /100 | #89 | Exceptional 4.7% |