Immigrants from Congo vs Immigrants from Zaire Average Family Size
COMPARE
Immigrants from Congo
Immigrants from Zaire
Average Family Size
Average Family Size Comparison
Immigrants from Congo
Immigrants from Zaire
3.23
AVERAGE FAMILY SIZE
52.7/ 100
METRIC RATING
172nd/ 347
METRIC RANK
3.22
AVERAGE FAMILY SIZE
30.5/ 100
METRIC RATING
191st/ 347
METRIC RANK
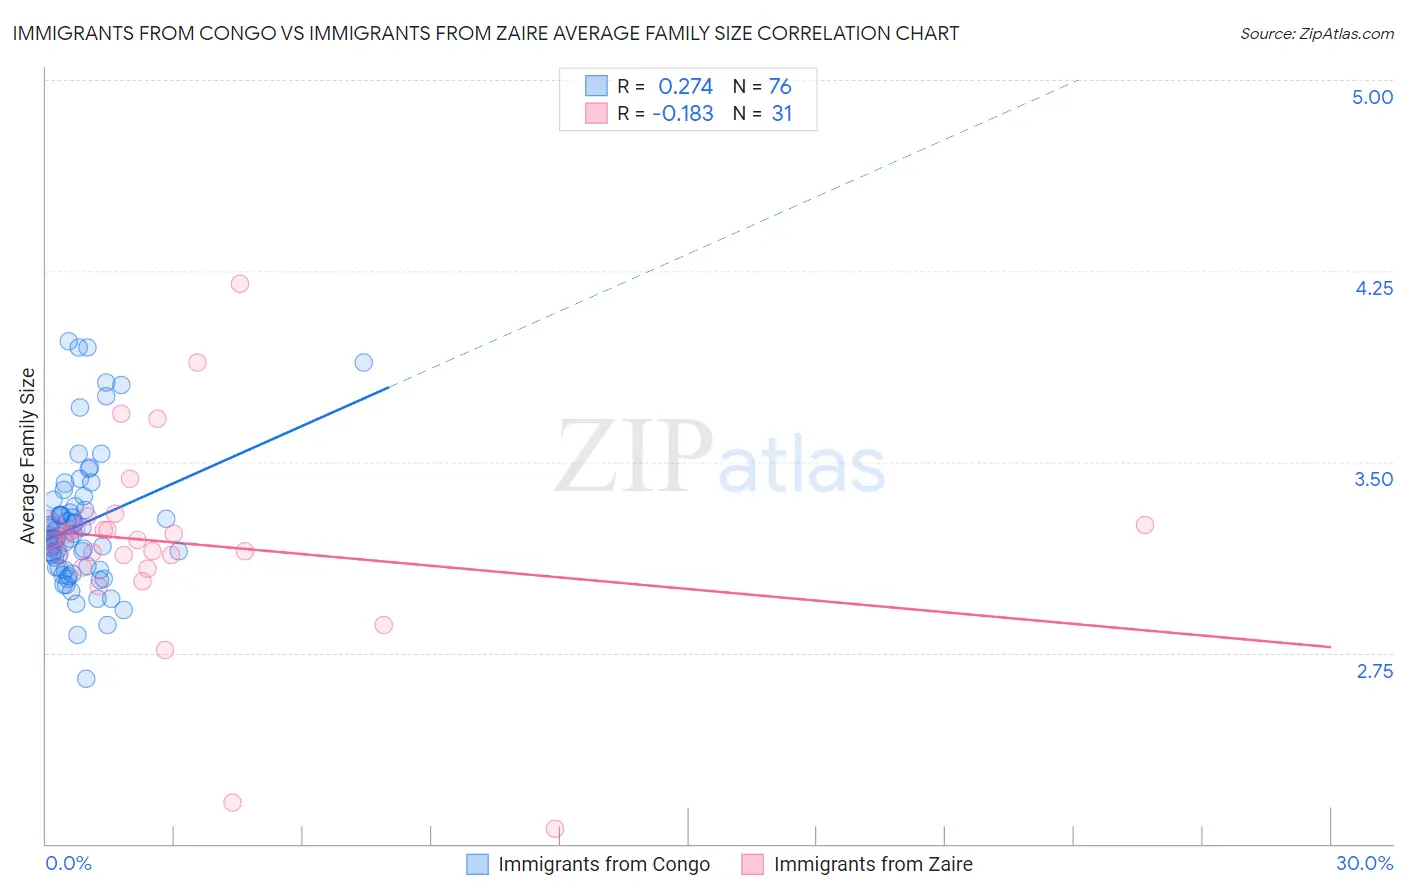
Immigrants from Congo vs Immigrants from Zaire Average Family Size Correlation Chart
The statistical analysis conducted on geographies consisting of 92,087,751 people shows a weak positive correlation between the proportion of Immigrants from Congo and average family size in the United States with a correlation coefficient (R) of 0.274 and weighted average of 3.23. Similarly, the statistical analysis conducted on geographies consisting of 107,246,225 people shows a poor negative correlation between the proportion of Immigrants from Zaire and average family size in the United States with a correlation coefficient (R) of -0.183 and weighted average of 3.22, a difference of 0.43%.
Average Family Size Correlation Summary
| Measurement | Immigrants from Congo | Immigrants from Zaire |
| Minimum | 2.65 | 2.06 |
| Maximum | 3.97 | 4.20 |
| Range | 1.32 | 2.14 |
| Mean | 3.25 | 3.18 |
| Median | 3.21 | 3.19 |
| Interquartile 25% (IQ1) | 3.09 | 3.08 |
| Interquartile 75% (IQ3) | 3.32 | 3.25 |
| Interquartile Range (IQR) | 0.23 | 0.17 |
| Standard Deviation (Sample) | 0.26 | 0.40 |
| Standard Deviation (Population) | 0.26 | 0.39 |
Demographics Similar to Immigrants from Congo and Immigrants from Zaire by Average Family Size
In terms of average family size, the demographic groups most similar to Immigrants from Congo are Chilean (3.23, a difference of 0.010%), Immigrants from Uruguay (3.23, a difference of 0.010%), Immigrants from South Central Asia (3.23, a difference of 0.050%), Immigrants from China (3.23, a difference of 0.050%), and Israeli (3.23, a difference of 0.070%). Similarly, the demographic groups most similar to Immigrants from Zaire are Burmese (3.22, a difference of 0.010%), Pakistani (3.22, a difference of 0.070%), Thai (3.22, a difference of 0.16%), Immigrants from Malaysia (3.22, a difference of 0.17%), and Immigrants from Sri Lanka (3.22, a difference of 0.19%).
| Demographics | Rating | Rank | Average Family Size |
| Chileans | 53.2 /100 | #171 | Average 3.23 |
| Immigrants | Congo | 52.7 /100 | #172 | Average 3.23 |
| Immigrants | Uruguay | 52.0 /100 | #173 | Average 3.23 |
| Immigrants | South Central Asia | 50.0 /100 | #174 | Average 3.23 |
| Immigrants | China | 49.9 /100 | #175 | Average 3.23 |
| Israelis | 48.7 /100 | #176 | Average 3.23 |
| Argentineans | 47.4 /100 | #177 | Average 3.23 |
| Spaniards | 47.2 /100 | #178 | Average 3.23 |
| Immigrants | Korea | 46.9 /100 | #179 | Average 3.23 |
| Palestinians | 46.6 /100 | #180 | Average 3.23 |
| Spanish | 44.8 /100 | #181 | Average 3.23 |
| Moroccans | 44.2 /100 | #182 | Average 3.22 |
| Immigrants | Northern Africa | 41.7 /100 | #183 | Average 3.22 |
| Immigrants | Eastern Asia | 40.8 /100 | #184 | Average 3.22 |
| Immigrants | Sri Lanka | 39.8 /100 | #185 | Fair 3.22 |
| Immigrants | Argentina | 39.8 /100 | #186 | Fair 3.22 |
| Immigrants | Malaysia | 39.0 /100 | #187 | Fair 3.22 |
| Thais | 38.3 /100 | #188 | Fair 3.22 |
| Pakistanis | 33.7 /100 | #189 | Fair 3.22 |
| Burmese | 31.0 /100 | #190 | Fair 3.22 |
| Immigrants | Zaire | 30.5 /100 | #191 | Fair 3.22 |