Chinese vs Serbian Median Male Earnings
COMPARE
Chinese
Serbian
Median Male Earnings
Median Male Earnings Comparison
Chinese
Serbians
$56,872
MEDIAN MALE EARNINGS
91.1/ 100
METRIC RATING
126th/ 347
METRIC RANK
$57,975
MEDIAN MALE EARNINGS
96.8/ 100
METRIC RATING
107th/ 347
METRIC RANK
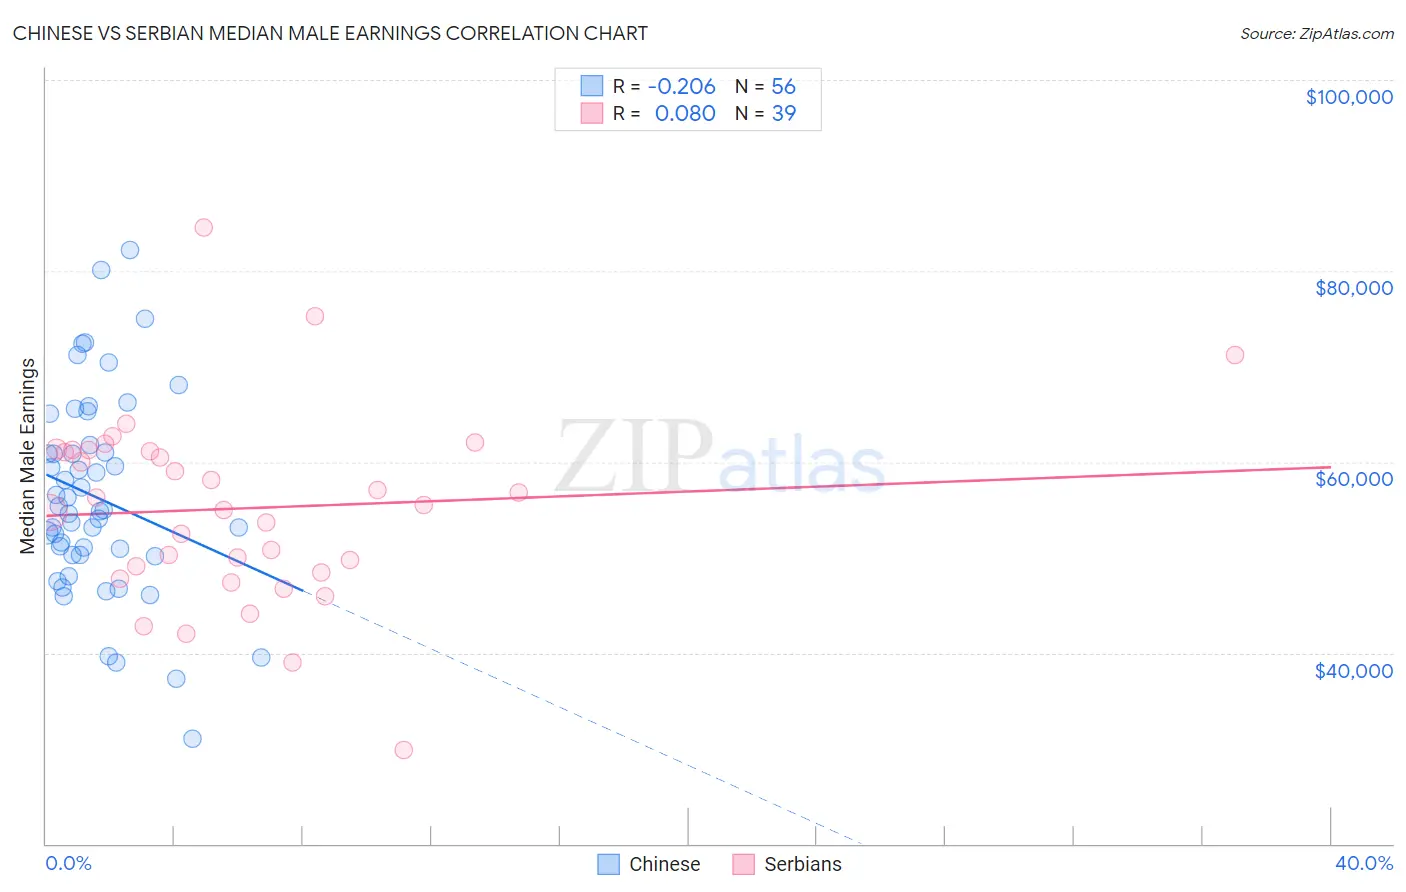
Chinese vs Serbian Median Male Earnings Correlation Chart
The statistical analysis conducted on geographies consisting of 64,807,348 people shows a weak negative correlation between the proportion of Chinese and median male earnings in the United States with a correlation coefficient (R) of -0.206 and weighted average of $56,872. Similarly, the statistical analysis conducted on geographies consisting of 267,612,597 people shows a slight positive correlation between the proportion of Serbians and median male earnings in the United States with a correlation coefficient (R) of 0.080 and weighted average of $57,975, a difference of 1.9%.
Median Male Earnings Correlation Summary
| Measurement | Chinese | Serbian |
| Minimum | $31,000 | $29,881 |
| Maximum | $82,197 | $84,510 |
| Range | $51,197 | $54,629 |
| Mean | $56,277 | $55,134 |
| Median | $54,905 | $55,532 |
| Interquartile 25% (IQ1) | $50,221 | $48,361 |
| Interquartile 75% (IQ3) | $61,384 | $61,216 |
| Interquartile Range (IQR) | $11,163 | $12,855 |
| Standard Deviation (Sample) | $10,489 | $10,037 |
| Standard Deviation (Population) | $10,395 | $9,908 |
Demographics Similar to Chinese and Serbians by Median Male Earnings
In terms of median male earnings, the demographic groups most similar to Chinese are Immigrants from Morocco ($56,958, a difference of 0.15%), Chilean ($56,973, a difference of 0.18%), Immigrants from Jordan ($57,145, a difference of 0.48%), Slovene ($57,145, a difference of 0.48%), and Immigrants from Albania ($57,179, a difference of 0.54%). Similarly, the demographic groups most similar to Serbians are Immigrants from Northern Africa ($58,008, a difference of 0.060%), Immigrants from Uzbekistan ($57,941, a difference of 0.060%), British ($57,890, a difference of 0.15%), Palestinian ($57,778, a difference of 0.34%), and European ($57,637, a difference of 0.59%).
| Demographics | Rating | Rank | Median Male Earnings |
| Immigrants | Northern Africa | 96.9 /100 | #106 | Exceptional $58,008 |
| Serbians | 96.8 /100 | #107 | Exceptional $57,975 |
| Immigrants | Uzbekistan | 96.7 /100 | #108 | Exceptional $57,941 |
| British | 96.5 /100 | #109 | Exceptional $57,890 |
| Palestinians | 96.2 /100 | #110 | Exceptional $57,778 |
| Europeans | 95.6 /100 | #111 | Exceptional $57,637 |
| Immigrants | Afghanistan | 95.4 /100 | #112 | Exceptional $57,582 |
| Carpatho Rusyns | 95.3 /100 | #113 | Exceptional $57,572 |
| Immigrants | Kuwait | 95.3 /100 | #114 | Exceptional $57,562 |
| Swedes | 94.8 /100 | #115 | Exceptional $57,445 |
| Lebanese | 94.6 /100 | #116 | Exceptional $57,409 |
| Immigrants | Zimbabwe | 94.3 /100 | #117 | Exceptional $57,352 |
| Hungarians | 94.0 /100 | #118 | Exceptional $57,309 |
| Arabs | 94.0 /100 | #119 | Exceptional $57,298 |
| Canadians | 93.9 /100 | #120 | Exceptional $57,286 |
| Immigrants | Albania | 93.3 /100 | #121 | Exceptional $57,179 |
| Immigrants | Jordan | 93.1 /100 | #122 | Exceptional $57,145 |
| Slovenes | 93.1 /100 | #123 | Exceptional $57,145 |
| Chileans | 91.9 /100 | #124 | Exceptional $56,973 |
| Immigrants | Morocco | 91.8 /100 | #125 | Exceptional $56,958 |
| Chinese | 91.1 /100 | #126 | Exceptional $56,872 |