Inupiat vs Serbian Median Male Earnings
COMPARE
Inupiat
Serbian
Median Male Earnings
Median Male Earnings Comparison
Inupiat
Serbians
$47,281
MEDIAN MALE EARNINGS
0.1/ 100
METRIC RATING
296th/ 347
METRIC RANK
$57,975
MEDIAN MALE EARNINGS
96.8/ 100
METRIC RATING
107th/ 347
METRIC RANK
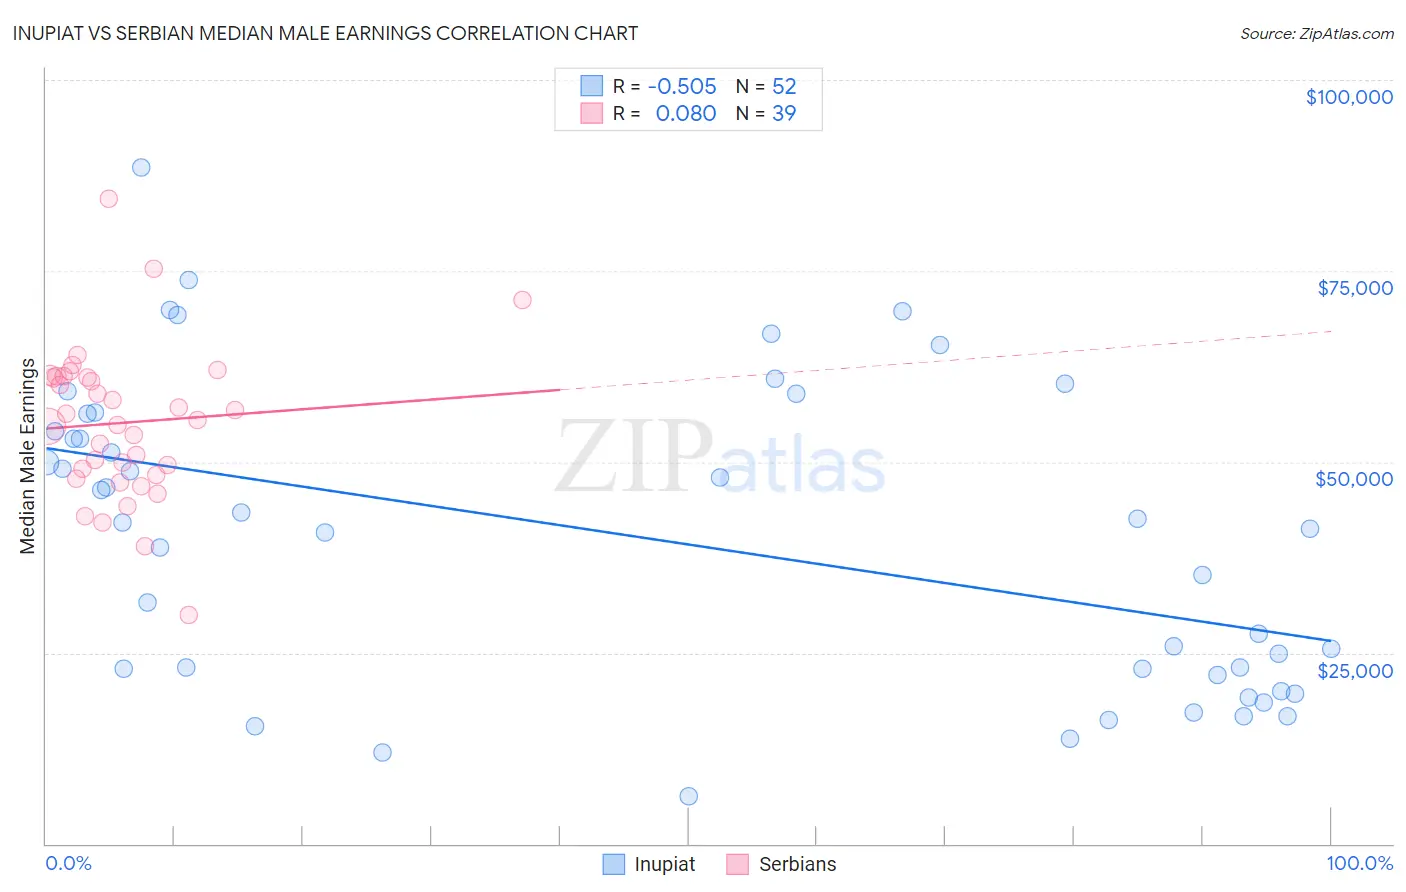
Inupiat vs Serbian Median Male Earnings Correlation Chart
The statistical analysis conducted on geographies consisting of 96,323,006 people shows a substantial negative correlation between the proportion of Inupiat and median male earnings in the United States with a correlation coefficient (R) of -0.505 and weighted average of $47,281. Similarly, the statistical analysis conducted on geographies consisting of 267,612,597 people shows a slight positive correlation between the proportion of Serbians and median male earnings in the United States with a correlation coefficient (R) of 0.080 and weighted average of $57,975, a difference of 22.6%.
Median Male Earnings Correlation Summary
| Measurement | Inupiat | Serbian |
| Minimum | $6,250 | $29,881 |
| Maximum | $88,594 | $84,510 |
| Range | $82,344 | $54,629 |
| Mean | $40,024 | $55,134 |
| Median | $41,688 | $55,532 |
| Interquartile 25% (IQ1) | $22,499 | $48,361 |
| Interquartile 75% (IQ3) | $55,179 | $61,216 |
| Interquartile Range (IQR) | $32,680 | $12,855 |
| Standard Deviation (Sample) | $19,878 | $10,037 |
| Standard Deviation (Population) | $19,686 | $9,908 |
Similar Demographics by Median Male Earnings
Demographics Similar to Inupiat by Median Male Earnings
In terms of median male earnings, the demographic groups most similar to Inupiat are Dominican ($47,204, a difference of 0.16%), Immigrants from Micronesia ($47,177, a difference of 0.22%), Central American Indian ($47,433, a difference of 0.32%), Immigrants from Nicaragua ($47,482, a difference of 0.43%), and Immigrants from Zaire ($47,070, a difference of 0.45%).
| Demographics | Rating | Rank | Median Male Earnings |
| Chickasaw | 0.1 /100 | #289 | Tragic $47,832 |
| Immigrants | Belize | 0.1 /100 | #290 | Tragic $47,809 |
| Choctaw | 0.1 /100 | #291 | Tragic $47,729 |
| Immigrants | Dominica | 0.1 /100 | #292 | Tragic $47,651 |
| Indonesians | 0.1 /100 | #293 | Tragic $47,503 |
| Immigrants | Nicaragua | 0.1 /100 | #294 | Tragic $47,482 |
| Central American Indians | 0.1 /100 | #295 | Tragic $47,433 |
| Inupiat | 0.1 /100 | #296 | Tragic $47,281 |
| Dominicans | 0.1 /100 | #297 | Tragic $47,204 |
| Immigrants | Micronesia | 0.1 /100 | #298 | Tragic $47,177 |
| Immigrants | Zaire | 0.1 /100 | #299 | Tragic $47,070 |
| U.S. Virgin Islanders | 0.1 /100 | #300 | Tragic $47,066 |
| Immigrants | Latin America | 0.1 /100 | #301 | Tragic $46,941 |
| Seminole | 0.1 /100 | #302 | Tragic $46,783 |
| Yaqui | 0.1 /100 | #303 | Tragic $46,777 |
Demographics Similar to Serbians by Median Male Earnings
In terms of median male earnings, the demographic groups most similar to Serbians are Immigrants from Northern Africa ($58,008, a difference of 0.060%), Immigrants from Uzbekistan ($57,941, a difference of 0.060%), British ($57,890, a difference of 0.15%), Armenian ($58,134, a difference of 0.27%), and Immigrants from Western Asia ($58,131, a difference of 0.27%).
| Demographics | Rating | Rank | Median Male Earnings |
| Assyrians/Chaldeans/Syriacs | 97.9 /100 | #100 | Exceptional $58,437 |
| Immigrants | Brazil | 97.7 /100 | #101 | Exceptional $58,324 |
| Syrians | 97.4 /100 | #102 | Exceptional $58,187 |
| Poles | 97.3 /100 | #103 | Exceptional $58,139 |
| Armenians | 97.3 /100 | #104 | Exceptional $58,134 |
| Immigrants | Western Asia | 97.3 /100 | #105 | Exceptional $58,131 |
| Immigrants | Northern Africa | 96.9 /100 | #106 | Exceptional $58,008 |
| Serbians | 96.8 /100 | #107 | Exceptional $57,975 |
| Immigrants | Uzbekistan | 96.7 /100 | #108 | Exceptional $57,941 |
| British | 96.5 /100 | #109 | Exceptional $57,890 |
| Palestinians | 96.2 /100 | #110 | Exceptional $57,778 |
| Europeans | 95.6 /100 | #111 | Exceptional $57,637 |
| Immigrants | Afghanistan | 95.4 /100 | #112 | Exceptional $57,582 |
| Carpatho Rusyns | 95.3 /100 | #113 | Exceptional $57,572 |
| Immigrants | Kuwait | 95.3 /100 | #114 | Exceptional $57,562 |