Immigrants from Panama vs Native/Alaskan Median Male Earnings
COMPARE
Immigrants from Panama
Native/Alaskan
Median Male Earnings
Median Male Earnings Comparison
Immigrants from Panama
Natives/Alaskans
$51,962
MEDIAN MALE EARNINGS
7.7/ 100
METRIC RATING
218th/ 347
METRIC RANK
$44,775
MEDIAN MALE EARNINGS
0.0/ 100
METRIC RATING
331st/ 347
METRIC RANK
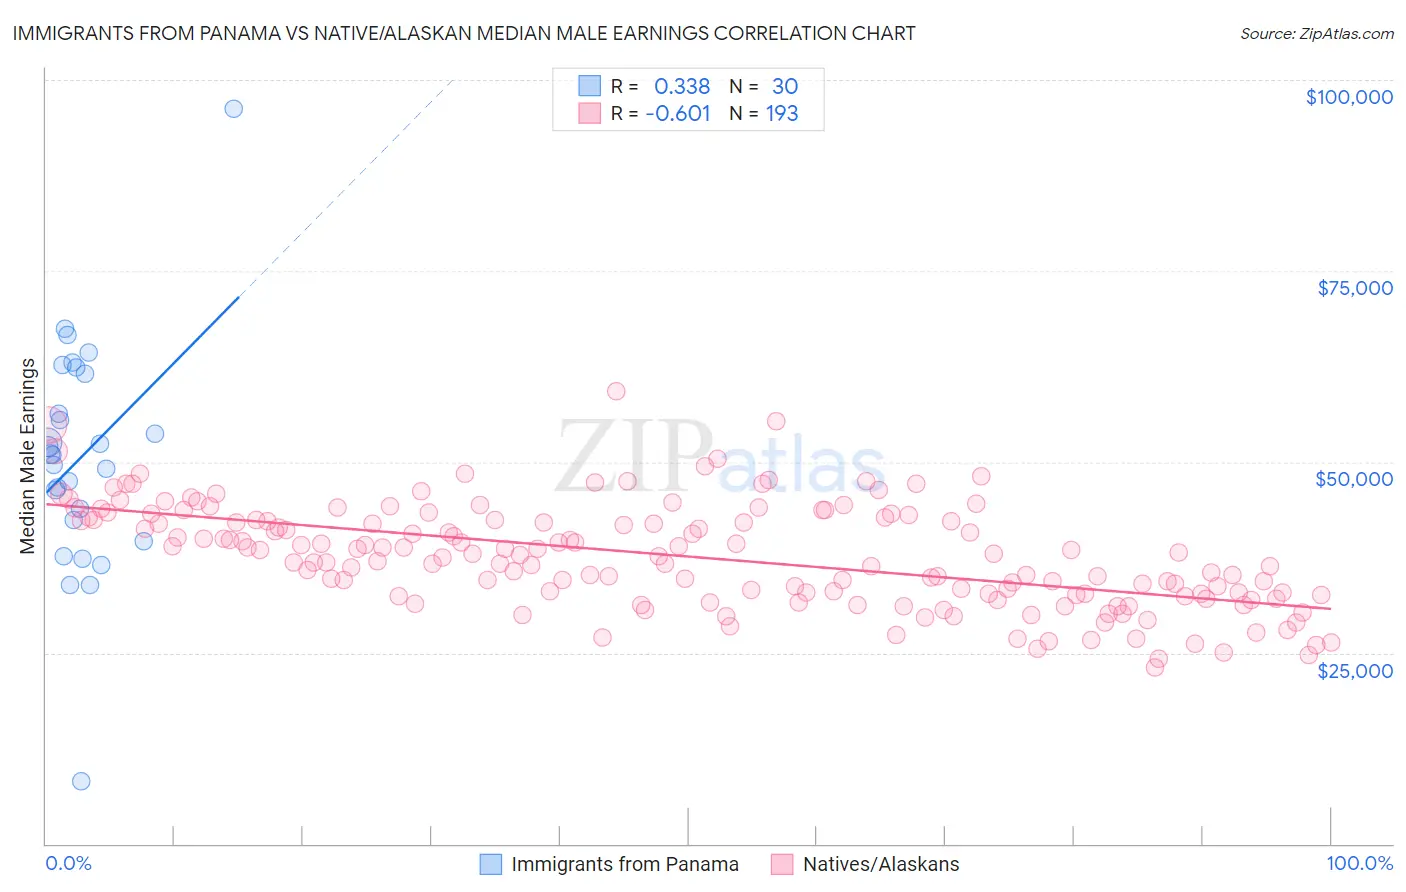
Immigrants from Panama vs Native/Alaskan Median Male Earnings Correlation Chart
The statistical analysis conducted on geographies consisting of 221,157,790 people shows a mild positive correlation between the proportion of Immigrants from Panama and median male earnings in the United States with a correlation coefficient (R) of 0.338 and weighted average of $51,962. Similarly, the statistical analysis conducted on geographies consisting of 512,408,867 people shows a significant negative correlation between the proportion of Natives/Alaskans and median male earnings in the United States with a correlation coefficient (R) of -0.601 and weighted average of $44,775, a difference of 16.1%.
Median Male Earnings Correlation Summary
| Measurement | Immigrants from Panama | Native/Alaskan |
| Minimum | $8,214 | $23,050 |
| Maximum | $96,250 | $59,216 |
| Range | $88,036 | $36,166 |
| Mean | $50,691 | $37,642 |
| Median | $50,981 | $37,848 |
| Interquartile 25% (IQ1) | $42,361 | $32,642 |
| Interquartile 75% (IQ3) | $61,515 | $42,387 |
| Interquartile Range (IQR) | $19,154 | $9,745 |
| Standard Deviation (Sample) | $15,111 | $6,692 |
| Standard Deviation (Population) | $14,857 | $6,675 |
Similar Demographics by Median Male Earnings
Demographics Similar to Immigrants from Panama by Median Male Earnings
In terms of median male earnings, the demographic groups most similar to Immigrants from Panama are Immigrants from Venezuela ($52,041, a difference of 0.15%), Nigerian ($52,039, a difference of 0.15%), Immigrants from Ghana ($51,836, a difference of 0.24%), Immigrants from Cameroon ($52,119, a difference of 0.30%), and Immigrants from Armenia ($51,793, a difference of 0.33%).
| Demographics | Rating | Rank | Median Male Earnings |
| Tlingit-Haida | 11.5 /100 | #211 | Poor $52,409 |
| Cajuns | 10.7 /100 | #212 | Poor $52,325 |
| Native Hawaiians | 10.5 /100 | #213 | Poor $52,306 |
| Immigrants | Nonimmigrants | 9.3 /100 | #214 | Tragic $52,170 |
| Immigrants | Cameroon | 8.9 /100 | #215 | Tragic $52,119 |
| Immigrants | Venezuela | 8.3 /100 | #216 | Tragic $52,041 |
| Nigerians | 8.3 /100 | #217 | Tragic $52,039 |
| Immigrants | Panama | 7.7 /100 | #218 | Tragic $51,962 |
| Immigrants | Ghana | 6.9 /100 | #219 | Tragic $51,836 |
| Immigrants | Armenia | 6.6 /100 | #220 | Tragic $51,793 |
| Immigrants | Senegal | 5.8 /100 | #221 | Tragic $51,647 |
| Immigrants | Bangladesh | 5.8 /100 | #222 | Tragic $51,642 |
| Ecuadorians | 5.5 /100 | #223 | Tragic $51,596 |
| Immigrants | Cambodia | 5.5 /100 | #224 | Tragic $51,594 |
| Immigrants | Sudan | 5.0 /100 | #225 | Tragic $51,489 |
Demographics Similar to Natives/Alaskans by Median Male Earnings
In terms of median male earnings, the demographic groups most similar to Natives/Alaskans are Bahamian ($44,756, a difference of 0.040%), Immigrants from Mexico ($44,960, a difference of 0.41%), Yakama ($45,002, a difference of 0.51%), Kiowa ($45,094, a difference of 0.71%), and Immigrants from Bahamas ($45,176, a difference of 0.90%).
| Demographics | Rating | Rank | Median Male Earnings |
| Blacks/African Americans | 0.0 /100 | #324 | Tragic $45,523 |
| Yuman | 0.0 /100 | #325 | Tragic $45,446 |
| Immigrants | Haiti | 0.0 /100 | #326 | Tragic $45,266 |
| Immigrants | Bahamas | 0.0 /100 | #327 | Tragic $45,176 |
| Kiowa | 0.0 /100 | #328 | Tragic $45,094 |
| Yakama | 0.0 /100 | #329 | Tragic $45,002 |
| Immigrants | Mexico | 0.0 /100 | #330 | Tragic $44,960 |
| Natives/Alaskans | 0.0 /100 | #331 | Tragic $44,775 |
| Bahamians | 0.0 /100 | #332 | Tragic $44,756 |
| Immigrants | Congo | 0.0 /100 | #333 | Tragic $44,204 |
| Immigrants | Yemen | 0.0 /100 | #334 | Tragic $44,083 |
| Spanish American Indians | 0.0 /100 | #335 | Tragic $44,010 |
| Immigrants | Cuba | 0.0 /100 | #336 | Tragic $43,461 |
| Menominee | 0.0 /100 | #337 | Tragic $42,581 |
| Crow | 0.0 /100 | #338 | Tragic $42,434 |