Immigrants from Burma/Myanmar vs Native/Alaskan Unemployment Among Ages 60 to 64 years
COMPARE
Immigrants from Burma/Myanmar
Native/Alaskan
Unemployment Among Ages 60 to 64 years
Unemployment Among Ages 60 to 64 years Comparison
Immigrants from Burma/Myanmar
Natives/Alaskans
4.4%
UNEMPLOYMENT AMONG AGES 60 TO 64 YEARS
100.0/ 100
METRIC RATING
24th/ 347
METRIC RANK
5.7%
UNEMPLOYMENT AMONG AGES 60 TO 64 YEARS
0.0/ 100
METRIC RATING
318th/ 347
METRIC RANK
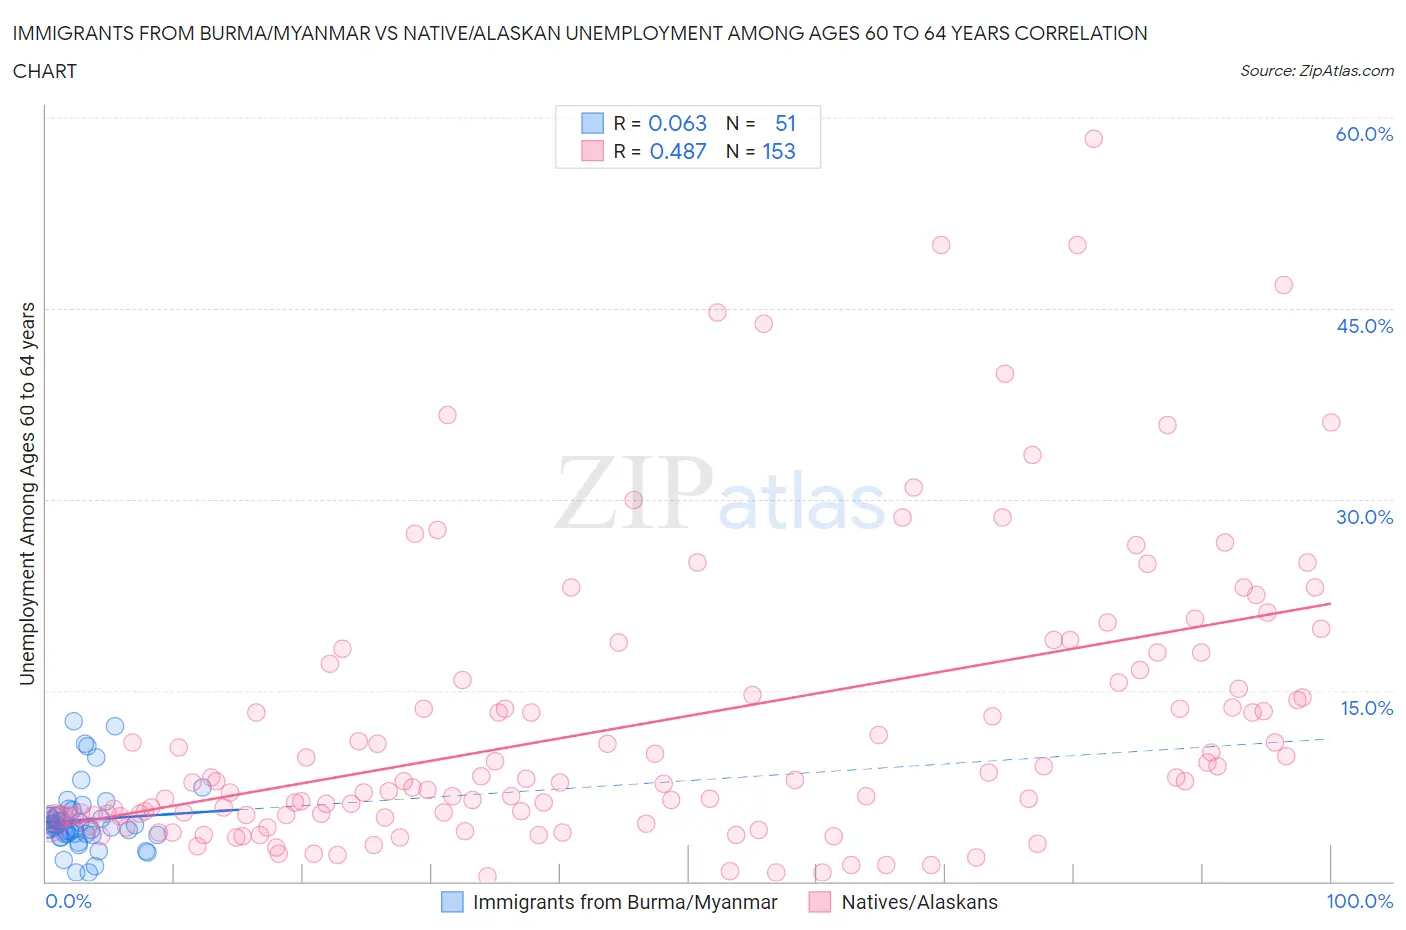
Immigrants from Burma/Myanmar vs Native/Alaskan Unemployment Among Ages 60 to 64 years Correlation Chart
The statistical analysis conducted on geographies consisting of 165,064,004 people shows a slight positive correlation between the proportion of Immigrants from Burma/Myanmar and unemployment rate among population between the ages 60 and 64 in the United States with a correlation coefficient (R) of 0.063 and weighted average of 4.4%. Similarly, the statistical analysis conducted on geographies consisting of 437,522,212 people shows a moderate positive correlation between the proportion of Natives/Alaskans and unemployment rate among population between the ages 60 and 64 in the United States with a correlation coefficient (R) of 0.487 and weighted average of 5.7%, a difference of 28.1%.
Unemployment Among Ages 60 to 64 years Correlation Summary
| Measurement | Immigrants from Burma/Myanmar | Native/Alaskan |
| Minimum | 0.70% | 0.40% |
| Maximum | 12.6% | 58.3% |
| Range | 11.9% | 57.9% |
| Mean | 4.8% | 12.4% |
| Median | 4.3% | 7.9% |
| Interquartile 25% (IQ1) | 3.6% | 5.1% |
| Interquartile 75% (IQ3) | 5.2% | 16.2% |
| Interquartile Range (IQR) | 1.6% | 11.1% |
| Standard Deviation (Sample) | 2.6% | 11.4% |
| Standard Deviation (Population) | 2.5% | 11.3% |
Similar Demographics by Unemployment Among Ages 60 to 64 years
Demographics Similar to Immigrants from Burma/Myanmar by Unemployment Among Ages 60 to 64 years
In terms of unemployment among ages 60 to 64 years, the demographic groups most similar to Immigrants from Burma/Myanmar are Immigrants from Zaire (4.4%, a difference of 0.23%), Cape Verdean (4.4%, a difference of 0.43%), Afghan (4.4%, a difference of 0.51%), Immigrants from Cabo Verde (4.4%, a difference of 0.51%), and Yugoslavian (4.4%, a difference of 0.64%).
| Demographics | Rating | Rank | Unemployment Among Ages 60 to 64 years |
| Immigrants | Afghanistan | 100.0 /100 | #17 | Exceptional 4.4% |
| Slovenes | 100.0 /100 | #18 | Exceptional 4.4% |
| Tsimshian | 100.0 /100 | #19 | Exceptional 4.4% |
| Afghans | 100.0 /100 | #20 | Exceptional 4.4% |
| Immigrants | Cabo Verde | 100.0 /100 | #21 | Exceptional 4.4% |
| Cape Verdeans | 100.0 /100 | #22 | Exceptional 4.4% |
| Immigrants | Zaire | 100.0 /100 | #23 | Exceptional 4.4% |
| Immigrants | Burma/Myanmar | 100.0 /100 | #24 | Exceptional 4.4% |
| Yugoslavians | 100.0 /100 | #25 | Exceptional 4.4% |
| Czechs | 100.0 /100 | #26 | Exceptional 4.4% |
| Immigrants | Iraq | 100.0 /100 | #27 | Exceptional 4.5% |
| Immigrants | Nepal | 100.0 /100 | #28 | Exceptional 4.5% |
| Cubans | 100.0 /100 | #29 | Exceptional 4.5% |
| Immigrants | Venezuela | 100.0 /100 | #30 | Exceptional 4.5% |
| Immigrants | Eritrea | 100.0 /100 | #31 | Exceptional 4.5% |
Demographics Similar to Natives/Alaskans by Unemployment Among Ages 60 to 64 years
In terms of unemployment among ages 60 to 64 years, the demographic groups most similar to Natives/Alaskans are Shoshone (5.7%, a difference of 0.050%), Immigrants from Belize (5.7%, a difference of 0.49%), Cheyenne (5.6%, a difference of 0.91%), Colville (5.7%, a difference of 1.3%), and Cree (5.6%, a difference of 1.3%).
| Demographics | Rating | Rank | Unemployment Among Ages 60 to 64 years |
| U.S. Virgin Islanders | 0.0 /100 | #311 | Tragic 5.5% |
| Immigrants | West Indies | 0.0 /100 | #312 | Tragic 5.5% |
| Belizeans | 0.0 /100 | #313 | Tragic 5.5% |
| Guyanese | 0.0 /100 | #314 | Tragic 5.5% |
| Cree | 0.0 /100 | #315 | Tragic 5.6% |
| Cheyenne | 0.0 /100 | #316 | Tragic 5.6% |
| Shoshone | 0.0 /100 | #317 | Tragic 5.7% |
| Natives/Alaskans | 0.0 /100 | #318 | Tragic 5.7% |
| Immigrants | Belize | 0.0 /100 | #319 | Tragic 5.7% |
| Colville | 0.0 /100 | #320 | Tragic 5.7% |
| Dutch West Indians | 0.0 /100 | #321 | Tragic 5.7% |
| Ecuadorians | 0.0 /100 | #322 | Tragic 5.8% |
| Alsatians | 0.0 /100 | #323 | Tragic 5.8% |
| Immigrants | Ecuador | 0.0 /100 | #324 | Tragic 5.8% |
| Paiute | 0.0 /100 | #325 | Tragic 5.8% |