Immigrants from Burma/Myanmar vs Native/Alaskan Single Mother Poverty
COMPARE
Immigrants from Burma/Myanmar
Native/Alaskan
Single Mother Poverty
Single Mother Poverty Comparison
Immigrants from Burma/Myanmar
Natives/Alaskans
30.6%
SINGLE MOTHER POVERTY
1.7/ 100
METRIC RATING
242nd/ 347
METRIC RANK
36.6%
SINGLE MOTHER POVERTY
0.0/ 100
METRIC RATING
330th/ 347
METRIC RANK
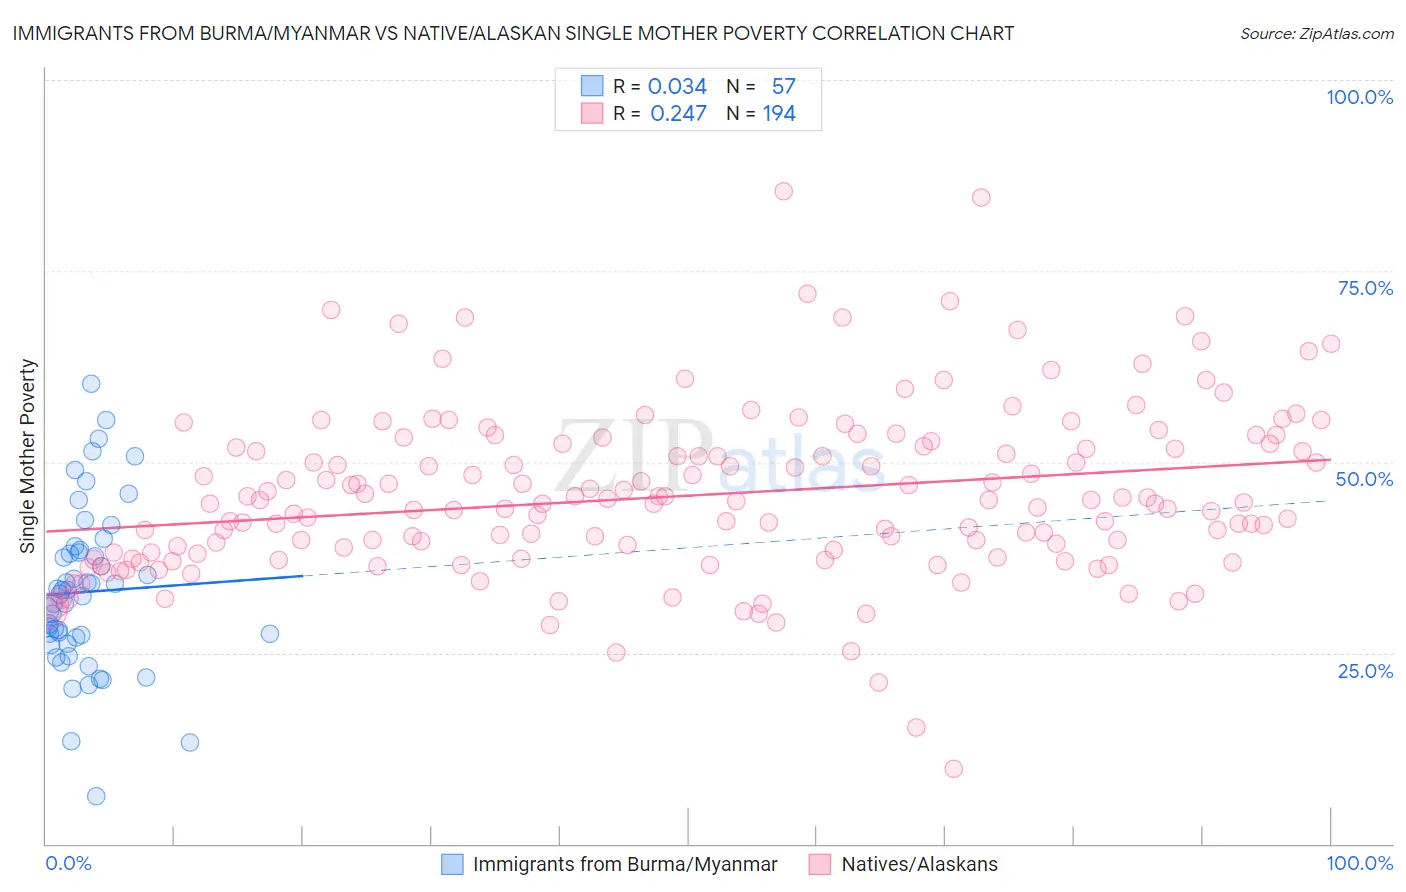
Immigrants from Burma/Myanmar vs Native/Alaskan Single Mother Poverty Correlation Chart
The statistical analysis conducted on geographies consisting of 170,565,038 people shows no correlation between the proportion of Immigrants from Burma/Myanmar and poverty level among single mothers in the United States with a correlation coefficient (R) of 0.034 and weighted average of 30.6%. Similarly, the statistical analysis conducted on geographies consisting of 497,815,701 people shows a weak positive correlation between the proportion of Natives/Alaskans and poverty level among single mothers in the United States with a correlation coefficient (R) of 0.247 and weighted average of 36.6%, a difference of 19.8%.
Single Mother Poverty Correlation Summary
| Measurement | Immigrants from Burma/Myanmar | Native/Alaskan |
| Minimum | 6.2% | 9.8% |
| Maximum | 60.3% | 85.4% |
| Range | 54.0% | 75.6% |
| Mean | 33.0% | 45.6% |
| Median | 32.7% | 44.6% |
| Interquartile 25% (IQ1) | 26.6% | 37.9% |
| Interquartile 75% (IQ3) | 38.3% | 52.0% |
| Interquartile Range (IQR) | 11.7% | 14.1% |
| Standard Deviation (Sample) | 10.6% | 11.2% |
| Standard Deviation (Population) | 10.5% | 11.2% |
Similar Demographics by Single Mother Poverty
Demographics Similar to Immigrants from Burma/Myanmar by Single Mother Poverty
In terms of single mother poverty, the demographic groups most similar to Immigrants from Burma/Myanmar are Immigrants from Laos (30.6%, a difference of 0.020%), Salvadoran (30.6%, a difference of 0.070%), Bermudan (30.6%, a difference of 0.080%), Immigrants from Portugal (30.5%, a difference of 0.20%), and French (30.7%, a difference of 0.30%).
| Demographics | Rating | Rank | Single Mother Poverty |
| Immigrants | Grenada | 3.4 /100 | #235 | Tragic 30.3% |
| Welsh | 3.2 /100 | #236 | Tragic 30.4% |
| Immigrants | St. Vincent and the Grenadines | 3.1 /100 | #237 | Tragic 30.4% |
| Slovaks | 2.8 /100 | #238 | Tragic 30.4% |
| Immigrants | Portugal | 2.1 /100 | #239 | Tragic 30.5% |
| Salvadorans | 1.8 /100 | #240 | Tragic 30.6% |
| Immigrants | Laos | 1.8 /100 | #241 | Tragic 30.6% |
| Immigrants | Burma/Myanmar | 1.7 /100 | #242 | Tragic 30.6% |
| Bermudans | 1.6 /100 | #243 | Tragic 30.6% |
| French | 1.3 /100 | #244 | Tragic 30.7% |
| Barbadians | 1.3 /100 | #245 | Tragic 30.7% |
| Ecuadorians | 0.9 /100 | #246 | Tragic 30.8% |
| West Indians | 0.9 /100 | #247 | Tragic 30.8% |
| French Canadians | 0.9 /100 | #248 | Tragic 30.8% |
| Cape Verdeans | 0.8 /100 | #249 | Tragic 30.8% |
Demographics Similar to Natives/Alaskans by Single Mother Poverty
In terms of single mother poverty, the demographic groups most similar to Natives/Alaskans are Apache (36.6%, a difference of 0.10%), Creek (36.7%, a difference of 0.16%), Dutch West Indian (36.8%, a difference of 0.40%), Choctaw (36.4%, a difference of 0.58%), and Yakama (36.4%, a difference of 0.64%).
| Demographics | Rating | Rank | Single Mother Poverty |
| Kiowa | 0.0 /100 | #323 | Tragic 35.5% |
| Ottawa | 0.0 /100 | #324 | Tragic 35.5% |
| Ute | 0.0 /100 | #325 | Tragic 35.7% |
| Seminole | 0.0 /100 | #326 | Tragic 35.8% |
| Yakama | 0.0 /100 | #327 | Tragic 36.4% |
| Choctaw | 0.0 /100 | #328 | Tragic 36.4% |
| Apache | 0.0 /100 | #329 | Tragic 36.6% |
| Natives/Alaskans | 0.0 /100 | #330 | Tragic 36.6% |
| Creek | 0.0 /100 | #331 | Tragic 36.7% |
| Dutch West Indians | 0.0 /100 | #332 | Tragic 36.8% |
| Menominee | 0.0 /100 | #333 | Tragic 37.1% |
| Pueblo | 0.0 /100 | #334 | Tragic 37.2% |
| Yuman | 0.0 /100 | #335 | Tragic 37.8% |
| Cheyenne | 0.0 /100 | #336 | Tragic 38.5% |
| Immigrants | Yemen | 0.0 /100 | #337 | Tragic 38.5% |