Immigrants from Burma/Myanmar vs Immigrants from Jordan Median Family Income
COMPARE
Immigrants from Burma/Myanmar
Immigrants from Jordan
Median Family Income
Median Family Income Comparison
Immigrants from Burma/Myanmar
Immigrants from Jordan
$94,472
MEDIAN FAMILY INCOME
1.5/ 100
METRIC RATING
235th/ 347
METRIC RANK
$107,715
MEDIAN FAMILY INCOME
92.9/ 100
METRIC RATING
122nd/ 347
METRIC RANK
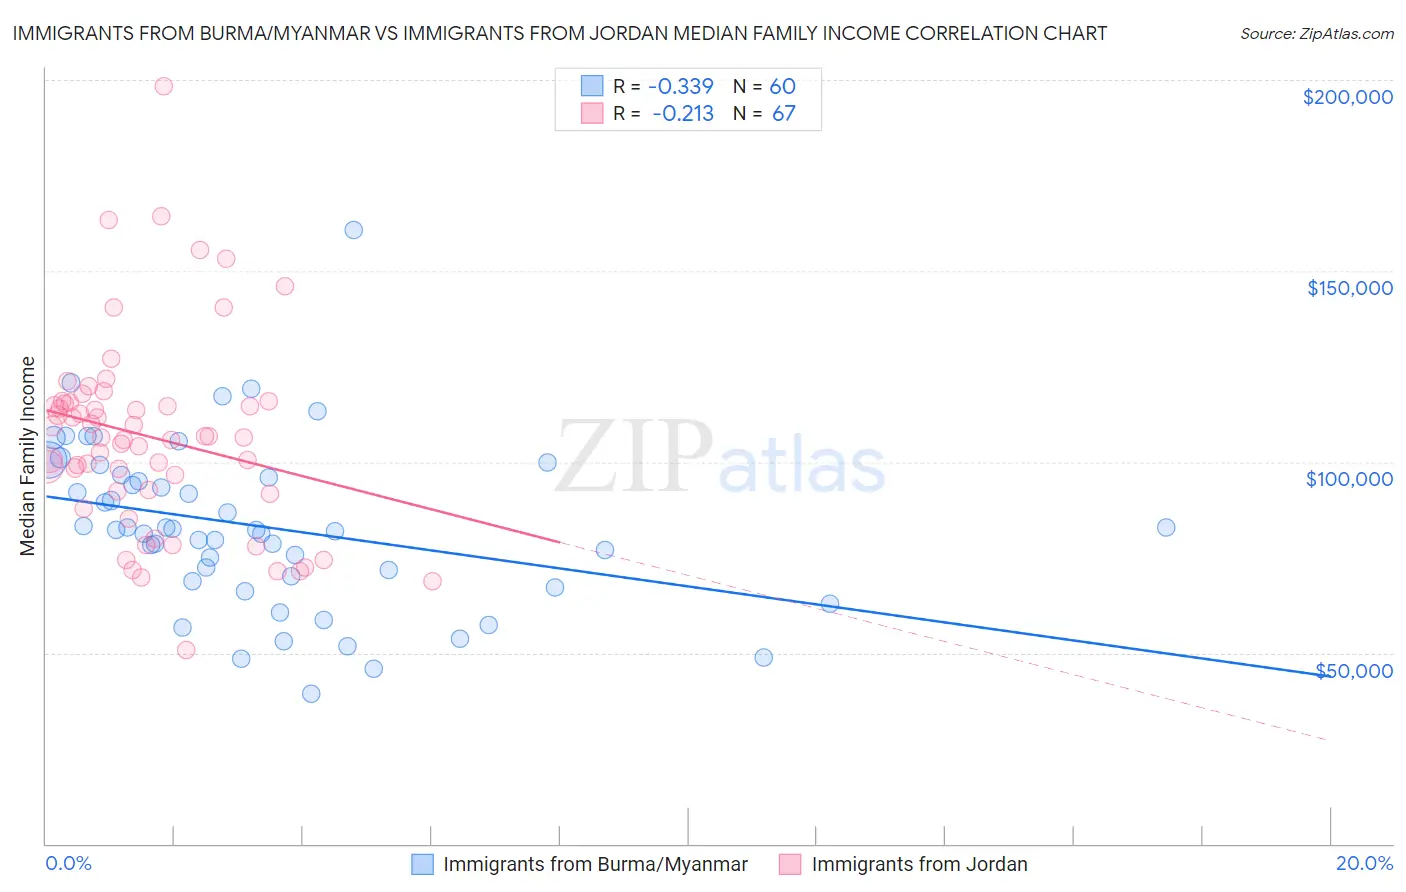
Immigrants from Burma/Myanmar vs Immigrants from Jordan Median Family Income Correlation Chart
The statistical analysis conducted on geographies consisting of 172,231,822 people shows a mild negative correlation between the proportion of Immigrants from Burma/Myanmar and median family income in the United States with a correlation coefficient (R) of -0.339 and weighted average of $94,472. Similarly, the statistical analysis conducted on geographies consisting of 181,223,835 people shows a weak negative correlation between the proportion of Immigrants from Jordan and median family income in the United States with a correlation coefficient (R) of -0.213 and weighted average of $107,715, a difference of 14.0%.
Median Family Income Correlation Summary
| Measurement | Immigrants from Burma/Myanmar | Immigrants from Jordan |
| Minimum | $39,136 | $50,608 |
| Maximum | $160,863 | $198,467 |
| Range | $121,727 | $147,858 |
| Mean | $83,083 | $106,593 |
| Median | $82,122 | $106,540 |
| Interquartile 25% (IQ1) | $69,331 | $92,338 |
| Interquartile 75% (IQ3) | $96,286 | $115,517 |
| Interquartile Range (IQR) | $26,955 | $23,179 |
| Standard Deviation (Sample) | $21,974 | $25,689 |
| Standard Deviation (Population) | $21,790 | $25,497 |
Similar Demographics by Median Family Income
Demographics Similar to Immigrants from Burma/Myanmar by Median Family Income
In terms of median family income, the demographic groups most similar to Immigrants from Burma/Myanmar are Trinidadian and Tobagonian ($94,466, a difference of 0.010%), Alaskan Athabascan ($94,429, a difference of 0.040%), Immigrants from Western Africa ($94,638, a difference of 0.18%), Immigrants from Bangladesh ($94,665, a difference of 0.20%), and Nepalese ($94,153, a difference of 0.34%).
| Demographics | Rating | Rank | Median Family Income |
| Immigrants | Azores | 2.4 /100 | #228 | Tragic $95,402 |
| Marshallese | 2.2 /100 | #229 | Tragic $95,293 |
| Malaysians | 2.2 /100 | #230 | Tragic $95,230 |
| Ecuadorians | 2.1 /100 | #231 | Tragic $95,114 |
| Immigrants | Venezuela | 1.9 /100 | #232 | Tragic $94,904 |
| Immigrants | Bangladesh | 1.6 /100 | #233 | Tragic $94,665 |
| Immigrants | Western Africa | 1.6 /100 | #234 | Tragic $94,638 |
| Immigrants | Burma/Myanmar | 1.5 /100 | #235 | Tragic $94,472 |
| Trinidadians and Tobagonians | 1.5 /100 | #236 | Tragic $94,466 |
| Alaskan Athabascans | 1.5 /100 | #237 | Tragic $94,429 |
| Nepalese | 1.3 /100 | #238 | Tragic $94,153 |
| Salvadorans | 1.2 /100 | #239 | Tragic $94,109 |
| Somalis | 1.2 /100 | #240 | Tragic $94,085 |
| Immigrants | Trinidad and Tobago | 1.2 /100 | #241 | Tragic $93,988 |
| Barbadians | 1.1 /100 | #242 | Tragic $93,919 |
Demographics Similar to Immigrants from Jordan by Median Family Income
In terms of median family income, the demographic groups most similar to Immigrants from Jordan are Carpatho Rusyn ($107,502, a difference of 0.20%), Pakistani ($107,390, a difference of 0.30%), European ($108,099, a difference of 0.36%), Taiwanese ($107,295, a difference of 0.39%), and Immigrants from Northern Africa ($108,161, a difference of 0.41%).
| Demographics | Rating | Rank | Median Family Income |
| Swedes | 95.1 /100 | #115 | Exceptional $108,499 |
| Chileans | 95.0 /100 | #116 | Exceptional $108,429 |
| Immigrants | Philippines | 94.6 /100 | #117 | Exceptional $108,288 |
| Ethiopians | 94.5 /100 | #118 | Exceptional $108,251 |
| Sri Lankans | 94.5 /100 | #119 | Exceptional $108,234 |
| Immigrants | Northern Africa | 94.3 /100 | #120 | Exceptional $108,161 |
| Europeans | 94.1 /100 | #121 | Exceptional $108,099 |
| Immigrants | Jordan | 92.9 /100 | #122 | Exceptional $107,715 |
| Carpatho Rusyns | 92.2 /100 | #123 | Exceptional $107,502 |
| Pakistanis | 91.7 /100 | #124 | Exceptional $107,390 |
| Taiwanese | 91.4 /100 | #125 | Exceptional $107,295 |
| Serbians | 90.8 /100 | #126 | Exceptional $107,157 |
| Lebanese | 90.5 /100 | #127 | Exceptional $107,086 |
| Immigrants | Ethiopia | 90.0 /100 | #128 | Excellent $106,969 |
| Arabs | 89.9 /100 | #129 | Excellent $106,952 |