Czech vs Immigrants from Jordan Median Female Earnings
COMPARE
Czech
Immigrants from Jordan
Median Female Earnings
Median Female Earnings Comparison
Czechs
Immigrants from Jordan
$38,992
MEDIAN FEMALE EARNINGS
18.7/ 100
METRIC RATING
203rd/ 347
METRIC RANK
$40,977
MEDIAN FEMALE EARNINGS
93.5/ 100
METRIC RATING
122nd/ 347
METRIC RANK
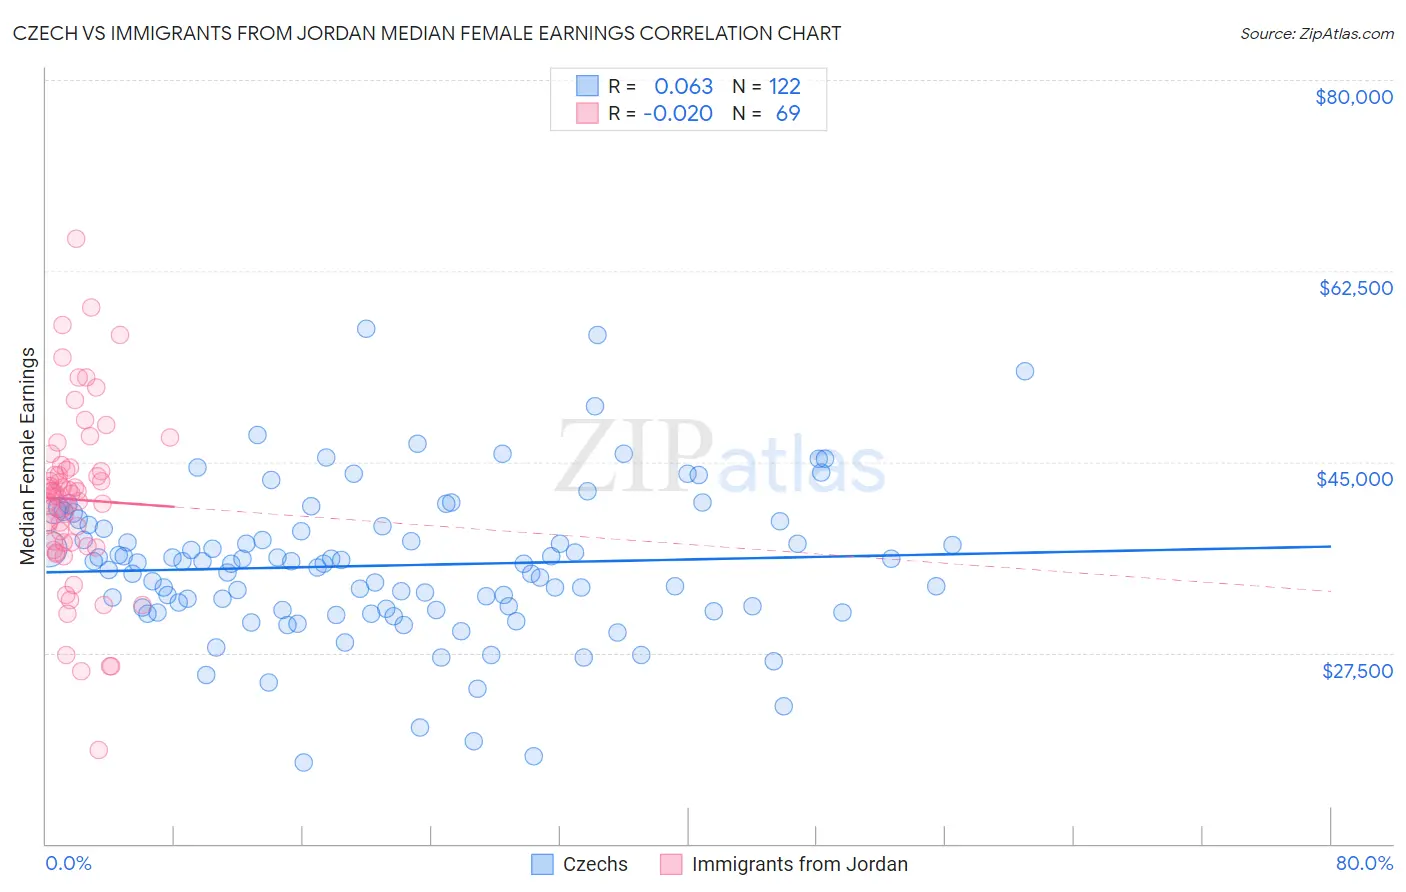
Czech vs Immigrants from Jordan Median Female Earnings Correlation Chart
The statistical analysis conducted on geographies consisting of 484,306,761 people shows a slight positive correlation between the proportion of Czechs and median female earnings in the United States with a correlation coefficient (R) of 0.063 and weighted average of $38,992. Similarly, the statistical analysis conducted on geographies consisting of 181,274,544 people shows no correlation between the proportion of Immigrants from Jordan and median female earnings in the United States with a correlation coefficient (R) of -0.020 and weighted average of $40,977, a difference of 5.1%.
Median Female Earnings Correlation Summary
| Measurement | Czech | Immigrants from Jordan |
| Minimum | $17,404 | $18,558 |
| Maximum | $57,188 | $65,466 |
| Range | $39,784 | $46,908 |
| Mean | $35,507 | $41,547 |
| Median | $35,690 | $42,113 |
| Interquartile 25% (IQ1) | $31,400 | $37,412 |
| Interquartile 75% (IQ3) | $39,083 | $44,413 |
| Interquartile Range (IQR) | $7,683 | $7,001 |
| Standard Deviation (Sample) | $6,872 | $8,068 |
| Standard Deviation (Population) | $6,843 | $8,010 |
Similar Demographics by Median Female Earnings
Demographics Similar to Czechs by Median Female Earnings
In terms of median female earnings, the demographic groups most similar to Czechs are Slovak ($39,029, a difference of 0.090%), Immigrants from Uruguay ($38,945, a difference of 0.12%), Immigrants from Panama ($39,049, a difference of 0.15%), Panamanian ($39,049, a difference of 0.15%), and Immigrants from Colombia ($38,913, a difference of 0.20%).
| Demographics | Rating | Rank | Median Female Earnings |
| Immigrants | Costa Rica | 25.6 /100 | #196 | Fair $39,186 |
| Assyrians/Chaldeans/Syriacs | 24.6 /100 | #197 | Fair $39,159 |
| Ecuadorians | 23.0 /100 | #198 | Fair $39,117 |
| Icelanders | 22.7 /100 | #199 | Fair $39,109 |
| Immigrants | Panama | 20.6 /100 | #200 | Fair $39,049 |
| Panamanians | 20.6 /100 | #201 | Fair $39,049 |
| Slovaks | 19.9 /100 | #202 | Poor $39,029 |
| Czechs | 18.7 /100 | #203 | Poor $38,992 |
| Immigrants | Uruguay | 17.3 /100 | #204 | Poor $38,945 |
| Immigrants | Colombia | 16.3 /100 | #205 | Poor $38,913 |
| Immigrants | Bosnia and Herzegovina | 15.6 /100 | #206 | Poor $38,886 |
| Immigrants | Cambodia | 14.2 /100 | #207 | Poor $38,833 |
| Immigrants | Thailand | 13.6 /100 | #208 | Poor $38,810 |
| Norwegians | 13.4 /100 | #209 | Poor $38,802 |
| Czechoslovakians | 12.0 /100 | #210 | Poor $38,738 |
Demographics Similar to Immigrants from Jordan by Median Female Earnings
In terms of median female earnings, the demographic groups most similar to Immigrants from Jordan are Guyanese ($40,973, a difference of 0.010%), Croatian ($40,993, a difference of 0.040%), Trinidadian and Tobagonian ($40,958, a difference of 0.050%), Austrian ($40,923, a difference of 0.13%), and Immigrants from Kuwait ($41,055, a difference of 0.19%).
| Demographics | Rating | Rank | Median Female Earnings |
| Koreans | 96.4 /100 | #115 | Exceptional $41,276 |
| Immigrants | Brazil | 96.4 /100 | #116 | Exceptional $41,273 |
| Barbadians | 96.3 /100 | #117 | Exceptional $41,261 |
| Immigrants | Lebanon | 95.6 /100 | #118 | Exceptional $41,183 |
| Immigrants | Philippines | 95.0 /100 | #119 | Exceptional $41,114 |
| Immigrants | Kuwait | 94.4 /100 | #120 | Exceptional $41,055 |
| Croatians | 93.7 /100 | #121 | Exceptional $40,993 |
| Immigrants | Jordan | 93.5 /100 | #122 | Exceptional $40,977 |
| Guyanese | 93.4 /100 | #123 | Exceptional $40,973 |
| Trinidadians and Tobagonians | 93.2 /100 | #124 | Exceptional $40,958 |
| Austrians | 92.7 /100 | #125 | Exceptional $40,923 |
| Immigrants | Trinidad and Tobago | 92.3 /100 | #126 | Exceptional $40,895 |
| Ugandans | 92.2 /100 | #127 | Exceptional $40,889 |
| Carpatho Rusyns | 91.2 /100 | #128 | Exceptional $40,825 |
| Zimbabweans | 90.8 /100 | #129 | Exceptional $40,798 |