Immigrants from Burma/Myanmar vs Immigrants from Jordan 12th Grade, No Diploma
COMPARE
Immigrants from Burma/Myanmar
Immigrants from Jordan
12th Grade, No Diploma
12th Grade, No Diploma Comparison
Immigrants from Burma/Myanmar
Immigrants from Jordan
88.9%
12TH GRADE, NO DIPLOMA
0.0/ 100
METRIC RATING
280th/ 347
METRIC RANK
91.8%
12TH GRADE, NO DIPLOMA
91.0/ 100
METRIC RATING
127th/ 347
METRIC RANK
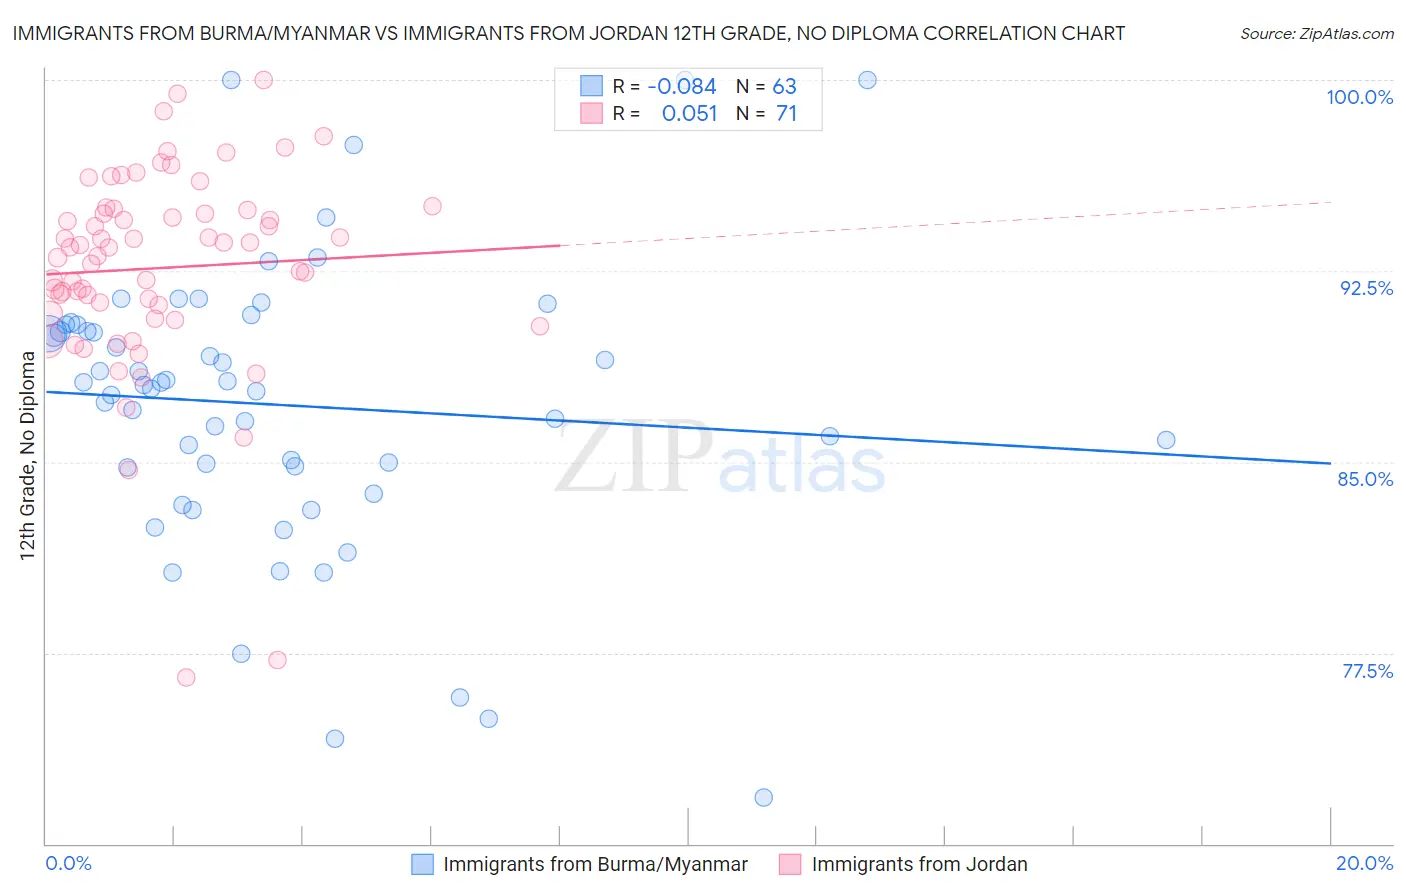
Immigrants from Burma/Myanmar vs Immigrants from Jordan 12th Grade, No Diploma Correlation Chart
The statistical analysis conducted on geographies consisting of 172,345,696 people shows a slight negative correlation between the proportion of Immigrants from Burma/Myanmar and percentage of population with at least 12th grade (no diploma) education in the United States with a correlation coefficient (R) of -0.084 and weighted average of 88.9%. Similarly, the statistical analysis conducted on geographies consisting of 181,278,272 people shows a slight positive correlation between the proportion of Immigrants from Jordan and percentage of population with at least 12th grade (no diploma) education in the United States with a correlation coefficient (R) of 0.051 and weighted average of 91.8%, a difference of 3.3%.
12th Grade, No Diploma Correlation Summary
| Measurement | Immigrants from Burma/Myanmar | Immigrants from Jordan |
| Minimum | 71.8% | 76.5% |
| Maximum | 100.0% | 100.0% |
| Range | 28.2% | 23.5% |
| Mean | 87.2% | 92.6% |
| Median | 88.0% | 93.4% |
| Interquartile 25% (IQ1) | 84.8% | 90.8% |
| Interquartile 75% (IQ3) | 90.4% | 94.9% |
| Interquartile Range (IQR) | 5.6% | 4.1% |
| Standard Deviation (Sample) | 5.7% | 4.1% |
| Standard Deviation (Population) | 5.6% | 4.0% |
Similar Demographics by 12th Grade, No Diploma
Demographics Similar to Immigrants from Burma/Myanmar by 12th Grade, No Diploma
In terms of 12th grade, no diploma, the demographic groups most similar to Immigrants from Burma/Myanmar are Immigrants from Laos (88.9%, a difference of 0.0%), Cuban (88.9%, a difference of 0.010%), Immigrants from St. Vincent and the Grenadines (88.9%, a difference of 0.070%), Immigrants from Barbados (89.0%, a difference of 0.13%), and Immigrants from Vietnam (88.7%, a difference of 0.18%).
| Demographics | Rating | Rank | 12th Grade, No Diploma |
| Barbadians | 0.1 /100 | #273 | Tragic 89.1% |
| Cajuns | 0.1 /100 | #274 | Tragic 89.1% |
| Immigrants | Congo | 0.1 /100 | #275 | Tragic 89.0% |
| Ute | 0.1 /100 | #276 | Tragic 89.0% |
| Immigrants | Barbados | 0.0 /100 | #277 | Tragic 89.0% |
| Immigrants | St. Vincent and the Grenadines | 0.0 /100 | #278 | Tragic 88.9% |
| Immigrants | Laos | 0.0 /100 | #279 | Tragic 88.9% |
| Immigrants | Burma/Myanmar | 0.0 /100 | #280 | Tragic 88.9% |
| Cubans | 0.0 /100 | #281 | Tragic 88.9% |
| Immigrants | Vietnam | 0.0 /100 | #282 | Tragic 88.7% |
| Paiute | 0.0 /100 | #283 | Tragic 88.7% |
| Pennsylvania Germans | 0.0 /100 | #284 | Tragic 88.7% |
| Indonesians | 0.0 /100 | #285 | Tragic 88.6% |
| Immigrants | West Indies | 0.0 /100 | #286 | Tragic 88.6% |
| Hopi | 0.0 /100 | #287 | Tragic 88.6% |
Demographics Similar to Immigrants from Jordan by 12th Grade, No Diploma
In terms of 12th grade, no diploma, the demographic groups most similar to Immigrants from Jordan are Basque (91.8%, a difference of 0.010%), Immigrants from Ukraine (91.8%, a difference of 0.020%), White/Caucasian (91.8%, a difference of 0.020%), Mongolian (91.8%, a difference of 0.040%), and German Russian (91.8%, a difference of 0.040%).
| Demographics | Rating | Rank | 12th Grade, No Diploma |
| Immigrants | Kazakhstan | 94.2 /100 | #120 | Exceptional 91.9% |
| Menominee | 93.5 /100 | #121 | Exceptional 91.9% |
| Ottawa | 93.1 /100 | #122 | Exceptional 91.9% |
| Egyptians | 92.5 /100 | #123 | Exceptional 91.9% |
| Immigrants | Ukraine | 91.6 /100 | #124 | Exceptional 91.8% |
| Whites/Caucasians | 91.6 /100 | #125 | Exceptional 91.8% |
| Basques | 91.3 /100 | #126 | Exceptional 91.8% |
| Immigrants | Jordan | 91.0 /100 | #127 | Exceptional 91.8% |
| Mongolians | 89.9 /100 | #128 | Excellent 91.8% |
| German Russians | 89.8 /100 | #129 | Excellent 91.8% |
| Assyrians/Chaldeans/Syriacs | 89.6 /100 | #130 | Excellent 91.8% |
| Albanians | 89.3 /100 | #131 | Excellent 91.8% |
| Immigrants | Eastern Asia | 89.3 /100 | #132 | Excellent 91.8% |
| Immigrants | Italy | 88.3 /100 | #133 | Excellent 91.7% |
| Venezuelans | 88.2 /100 | #134 | Excellent 91.7% |