Icelander vs Immigrants from Sierra Leone Per Capita Income
COMPARE
Icelander
Immigrants from Sierra Leone
Per Capita Income
Per Capita Income Comparison
Icelanders
Immigrants from Sierra Leone
$44,987
PER CAPITA INCOME
81.6/ 100
METRIC RATING
144th/ 347
METRIC RANK
$42,752
PER CAPITA INCOME
26.5/ 100
METRIC RATING
193rd/ 347
METRIC RANK
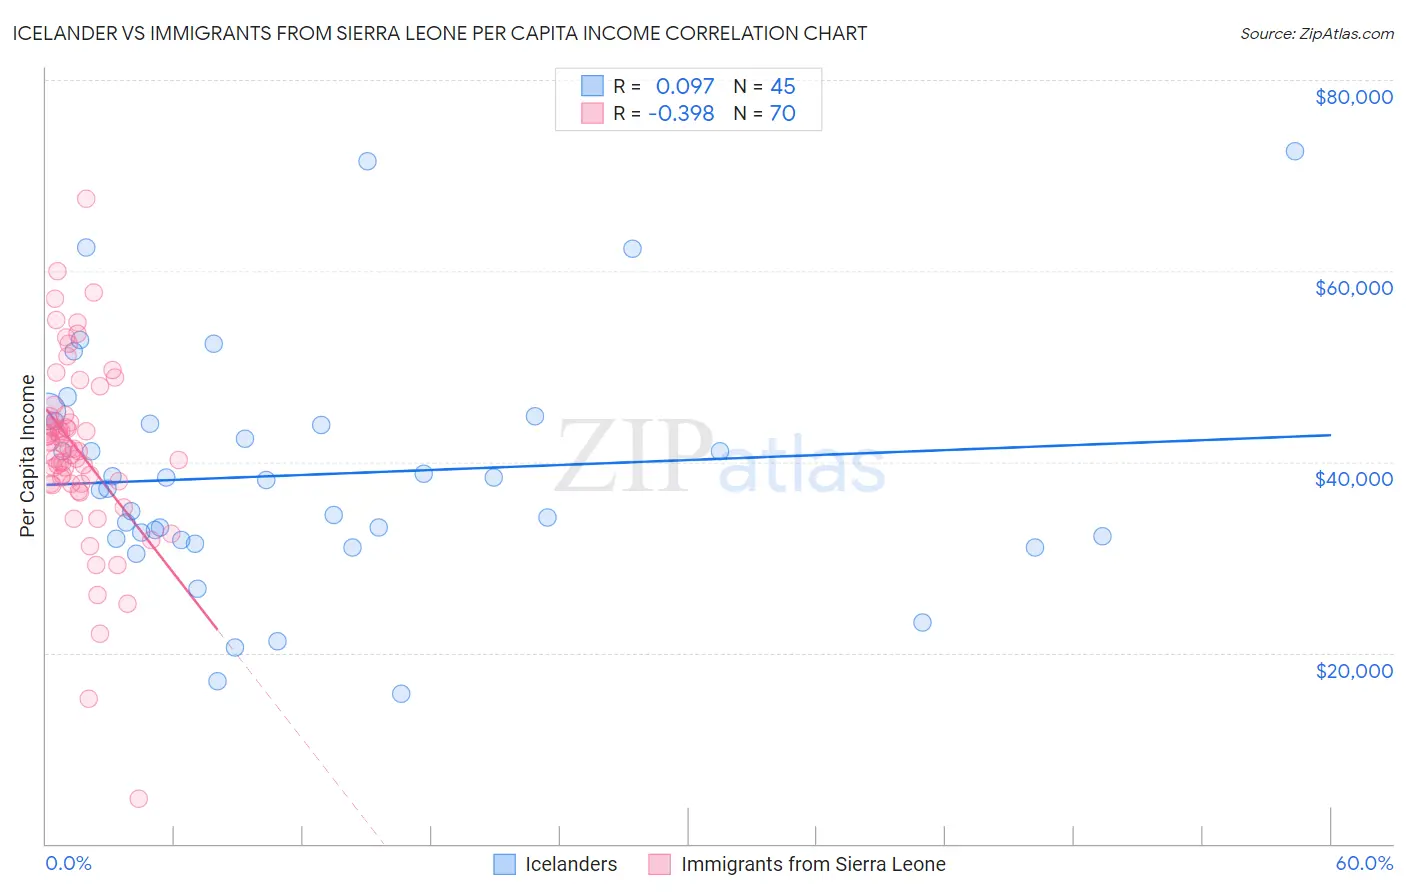
Icelander vs Immigrants from Sierra Leone Per Capita Income Correlation Chart
The statistical analysis conducted on geographies consisting of 159,668,759 people shows a slight positive correlation between the proportion of Icelanders and per capita income in the United States with a correlation coefficient (R) of 0.097 and weighted average of $44,987. Similarly, the statistical analysis conducted on geographies consisting of 101,626,660 people shows a mild negative correlation between the proportion of Immigrants from Sierra Leone and per capita income in the United States with a correlation coefficient (R) of -0.398 and weighted average of $42,752, a difference of 5.2%.
Per Capita Income Correlation Summary
| Measurement | Icelander | Immigrants from Sierra Leone |
| Minimum | $15,711 | $4,657 |
| Maximum | $72,483 | $67,610 |
| Range | $56,772 | $62,953 |
| Mean | $38,667 | $41,186 |
| Median | $37,248 | $41,327 |
| Interquartile 25% (IQ1) | $31,880 | $37,712 |
| Interquartile 75% (IQ3) | $44,123 | $44,823 |
| Interquartile Range (IQR) | $12,243 | $7,111 |
| Standard Deviation (Sample) | $12,398 | $9,754 |
| Standard Deviation (Population) | $12,260 | $9,684 |
Similar Demographics by Per Capita Income
Demographics Similar to Icelanders by Per Capita Income
In terms of per capita income, the demographic groups most similar to Icelanders are Immigrants from Uganda ($45,043, a difference of 0.12%), Ugandan ($45,047, a difference of 0.13%), Slavic ($45,049, a difference of 0.14%), Immigrants from Jordan ($45,066, a difference of 0.18%), and Basque ($45,086, a difference of 0.22%).
| Demographics | Rating | Rank | Per Capita Income |
| Immigrants | Syria | 85.2 /100 | #137 | Excellent $45,218 |
| Assyrians/Chaldeans/Syriacs | 84.8 /100 | #138 | Excellent $45,195 |
| Basques | 83.2 /100 | #139 | Excellent $45,086 |
| Immigrants | Jordan | 82.9 /100 | #140 | Excellent $45,066 |
| Slavs | 82.6 /100 | #141 | Excellent $45,049 |
| Ugandans | 82.6 /100 | #142 | Excellent $45,047 |
| Immigrants | Uganda | 82.5 /100 | #143 | Excellent $45,043 |
| Icelanders | 81.6 /100 | #144 | Excellent $44,987 |
| Immigrants | Afghanistan | 78.0 /100 | #145 | Good $44,790 |
| Irish | 75.8 /100 | #146 | Good $44,679 |
| Czechs | 74.1 /100 | #147 | Good $44,595 |
| Immigrants | Armenia | 73.1 /100 | #148 | Good $44,552 |
| Koreans | 72.5 /100 | #149 | Good $44,522 |
| Immigrants | Eritrea | 72.1 /100 | #150 | Good $44,509 |
| Norwegians | 71.5 /100 | #151 | Good $44,480 |
Demographics Similar to Immigrants from Sierra Leone by Per Capita Income
In terms of per capita income, the demographic groups most similar to Immigrants from Sierra Leone are Iraqi ($42,760, a difference of 0.020%), Yugoslavian ($42,792, a difference of 0.090%), Kenyan ($42,808, a difference of 0.13%), Immigrants from Fiji ($42,694, a difference of 0.13%), and Immigrants from Kenya ($42,661, a difference of 0.21%).
| Demographics | Rating | Rank | Per Capita Income |
| French Canadians | 32.3 /100 | #186 | Fair $43,003 |
| Immigrants | Colombia | 31.5 /100 | #187 | Fair $42,971 |
| Immigrants | Africa | 31.0 /100 | #188 | Fair $42,950 |
| Bermudans | 30.1 /100 | #189 | Fair $42,911 |
| Kenyans | 27.7 /100 | #190 | Fair $42,808 |
| Yugoslavians | 27.4 /100 | #191 | Fair $42,792 |
| Iraqis | 26.7 /100 | #192 | Fair $42,760 |
| Immigrants | Sierra Leone | 26.5 /100 | #193 | Fair $42,752 |
| Immigrants | Fiji | 25.2 /100 | #194 | Fair $42,694 |
| Immigrants | Kenya | 24.5 /100 | #195 | Fair $42,661 |
| Dutch | 23.4 /100 | #196 | Fair $42,605 |
| Scotch-Irish | 22.6 /100 | #197 | Fair $42,563 |
| Immigrants | Portugal | 19.7 /100 | #198 | Poor $42,412 |
| Barbadians | 19.6 /100 | #199 | Poor $42,406 |
| Vietnamese | 19.0 /100 | #200 | Poor $42,368 |