Icelander vs Polish Per Capita Income
COMPARE
Icelander
Polish
Per Capita Income
Per Capita Income Comparison
Icelanders
Poles
$44,987
PER CAPITA INCOME
81.6/ 100
METRIC RATING
144th/ 347
METRIC RANK
$46,123
PER CAPITA INCOME
94.1/ 100
METRIC RATING
116th/ 347
METRIC RANK
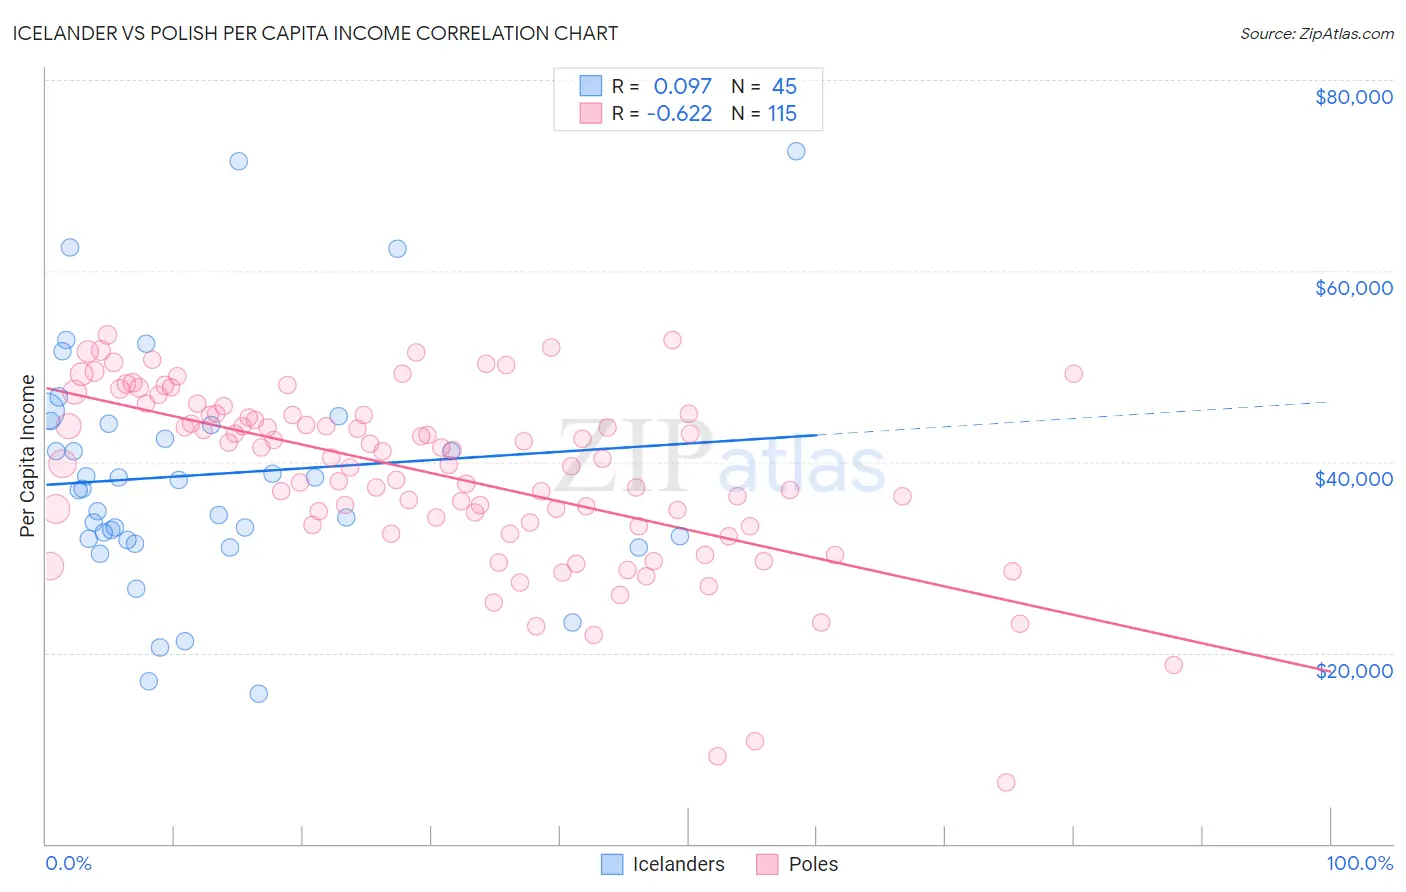
Icelander vs Polish Per Capita Income Correlation Chart
The statistical analysis conducted on geographies consisting of 159,668,759 people shows a slight positive correlation between the proportion of Icelanders and per capita income in the United States with a correlation coefficient (R) of 0.097 and weighted average of $44,987. Similarly, the statistical analysis conducted on geographies consisting of 560,657,396 people shows a significant negative correlation between the proportion of Poles and per capita income in the United States with a correlation coefficient (R) of -0.622 and weighted average of $46,123, a difference of 2.5%.
Per Capita Income Correlation Summary
| Measurement | Icelander | Polish |
| Minimum | $15,711 | $6,461 |
| Maximum | $72,483 | $53,317 |
| Range | $56,772 | $46,856 |
| Mean | $38,667 | $38,750 |
| Median | $37,248 | $40,450 |
| Interquartile 25% (IQ1) | $31,880 | $33,437 |
| Interquartile 75% (IQ3) | $44,123 | $44,990 |
| Interquartile Range (IQR) | $12,243 | $11,553 |
| Standard Deviation (Sample) | $12,398 | $9,315 |
| Standard Deviation (Population) | $12,260 | $9,274 |
Similar Demographics by Per Capita Income
Demographics Similar to Icelanders by Per Capita Income
In terms of per capita income, the demographic groups most similar to Icelanders are Immigrants from Uganda ($45,043, a difference of 0.12%), Ugandan ($45,047, a difference of 0.13%), Slavic ($45,049, a difference of 0.14%), Immigrants from Jordan ($45,066, a difference of 0.18%), and Basque ($45,086, a difference of 0.22%).
| Demographics | Rating | Rank | Per Capita Income |
| Immigrants | Syria | 85.2 /100 | #137 | Excellent $45,218 |
| Assyrians/Chaldeans/Syriacs | 84.8 /100 | #138 | Excellent $45,195 |
| Basques | 83.2 /100 | #139 | Excellent $45,086 |
| Immigrants | Jordan | 82.9 /100 | #140 | Excellent $45,066 |
| Slavs | 82.6 /100 | #141 | Excellent $45,049 |
| Ugandans | 82.6 /100 | #142 | Excellent $45,047 |
| Immigrants | Uganda | 82.5 /100 | #143 | Excellent $45,043 |
| Icelanders | 81.6 /100 | #144 | Excellent $44,987 |
| Immigrants | Afghanistan | 78.0 /100 | #145 | Good $44,790 |
| Irish | 75.8 /100 | #146 | Good $44,679 |
| Czechs | 74.1 /100 | #147 | Good $44,595 |
| Immigrants | Armenia | 73.1 /100 | #148 | Good $44,552 |
| Koreans | 72.5 /100 | #149 | Good $44,522 |
| Immigrants | Eritrea | 72.1 /100 | #150 | Good $44,509 |
| Norwegians | 71.5 /100 | #151 | Good $44,480 |
Demographics Similar to Poles by Per Capita Income
In terms of per capita income, the demographic groups most similar to Poles are Chinese ($46,098, a difference of 0.050%), Immigrants from Chile ($46,213, a difference of 0.20%), Immigrants from Saudi Arabia ($46,008, a difference of 0.25%), Immigrants from Poland ($45,979, a difference of 0.31%), and Afghan ($46,268, a difference of 0.32%).
| Demographics | Rating | Rank | Per Capita Income |
| Immigrants | Northern Africa | 96.2 /100 | #109 | Exceptional $46,531 |
| Chileans | 95.9 /100 | #110 | Exceptional $46,459 |
| Taiwanese | 95.8 /100 | #111 | Exceptional $46,455 |
| Immigrants | Morocco | 95.7 /100 | #112 | Exceptional $46,430 |
| Immigrants | Albania | 95.5 /100 | #113 | Exceptional $46,387 |
| Afghans | 94.9 /100 | #114 | Exceptional $46,268 |
| Immigrants | Chile | 94.6 /100 | #115 | Exceptional $46,213 |
| Poles | 94.1 /100 | #116 | Exceptional $46,123 |
| Chinese | 93.9 /100 | #117 | Exceptional $46,098 |
| Immigrants | Saudi Arabia | 93.3 /100 | #118 | Exceptional $46,008 |
| Immigrants | Poland | 93.1 /100 | #119 | Exceptional $45,979 |
| Immigrants | Ethiopia | 92.7 /100 | #120 | Exceptional $45,923 |
| Canadians | 92.2 /100 | #121 | Exceptional $45,858 |
| Moroccans | 92.1 /100 | #122 | Exceptional $45,854 |
| Lebanese | 92.0 /100 | #123 | Exceptional $45,840 |