Croatian vs Uruguayan Per Capita Income
COMPARE
Croatian
Uruguayan
Per Capita Income
Per Capita Income Comparison
Croatians
Uruguayans
$47,742
PER CAPITA INCOME
99.0/ 100
METRIC RATING
88th/ 347
METRIC RANK
$44,318
PER CAPITA INCOME
67.6/ 100
METRIC RATING
155th/ 347
METRIC RANK
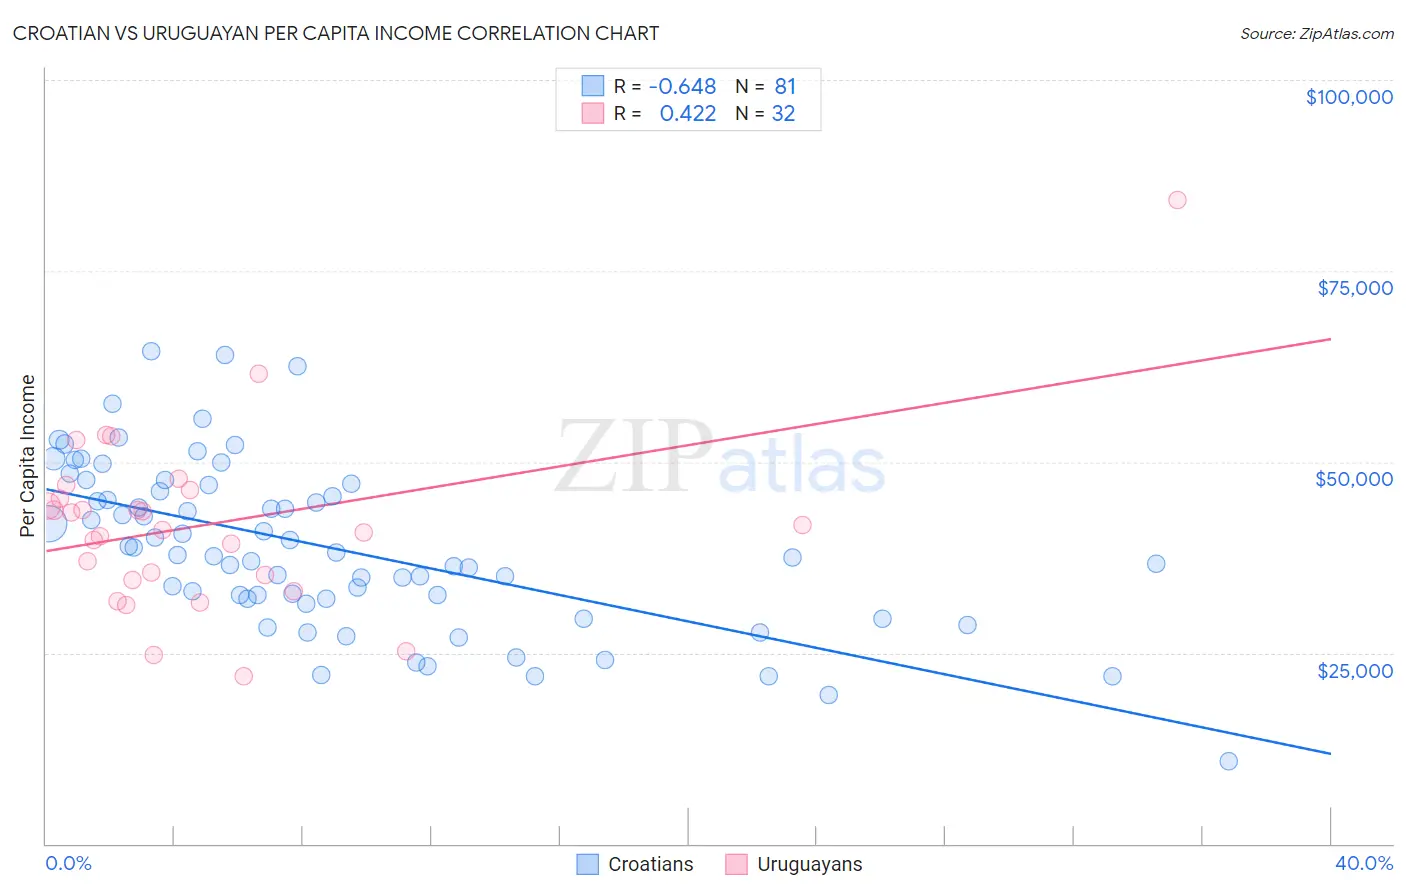
Croatian vs Uruguayan Per Capita Income Correlation Chart
The statistical analysis conducted on geographies consisting of 375,755,176 people shows a significant negative correlation between the proportion of Croatians and per capita income in the United States with a correlation coefficient (R) of -0.648 and weighted average of $47,742. Similarly, the statistical analysis conducted on geographies consisting of 144,785,218 people shows a moderate positive correlation between the proportion of Uruguayans and per capita income in the United States with a correlation coefficient (R) of 0.422 and weighted average of $44,318, a difference of 7.7%.
Per Capita Income Correlation Summary
| Measurement | Croatian | Uruguayan |
| Minimum | $10,765 | $21,859 |
| Maximum | $64,427 | $84,313 |
| Range | $53,662 | $62,454 |
| Mean | $38,757 | $41,831 |
| Median | $37,830 | $41,436 |
| Interquartile 25% (IQ1) | $32,092 | $34,824 |
| Interquartile 75% (IQ3) | $46,598 | $45,774 |
| Interquartile Range (IQR) | $14,505 | $10,950 |
| Standard Deviation (Sample) | $10,847 | $11,692 |
| Standard Deviation (Population) | $10,780 | $11,508 |
Similar Demographics by Per Capita Income
Demographics Similar to Croatians by Per Capita Income
In terms of per capita income, the demographic groups most similar to Croatians are Northern European ($47,698, a difference of 0.090%), Italian ($47,574, a difference of 0.35%), Macedonian ($47,573, a difference of 0.36%), Immigrants from Moldova ($47,489, a difference of 0.53%), and Ukrainian ($48,014, a difference of 0.57%).
| Demographics | Rating | Rank | Per Capita Income |
| Armenians | 99.4 /100 | #81 | Exceptional $48,287 |
| Immigrants | Indonesia | 99.4 /100 | #82 | Exceptional $48,195 |
| Immigrants | Brazil | 99.4 /100 | #83 | Exceptional $48,164 |
| Immigrants | Ukraine | 99.3 /100 | #84 | Exceptional $48,134 |
| Austrians | 99.3 /100 | #85 | Exceptional $48,116 |
| Immigrants | Southern Europe | 99.3 /100 | #86 | Exceptional $48,027 |
| Ukrainians | 99.3 /100 | #87 | Exceptional $48,014 |
| Croatians | 99.0 /100 | #88 | Exceptional $47,742 |
| Northern Europeans | 98.9 /100 | #89 | Exceptional $47,698 |
| Italians | 98.8 /100 | #90 | Exceptional $47,574 |
| Macedonians | 98.8 /100 | #91 | Exceptional $47,573 |
| Immigrants | Moldova | 98.7 /100 | #92 | Exceptional $47,489 |
| Immigrants | Zimbabwe | 98.5 /100 | #93 | Exceptional $47,394 |
| Albanians | 98.5 /100 | #94 | Exceptional $47,379 |
| Immigrants | Egypt | 98.5 /100 | #95 | Exceptional $47,361 |
Demographics Similar to Uruguayans by Per Capita Income
In terms of per capita income, the demographic groups most similar to Uruguayans are Portuguese ($44,362, a difference of 0.10%), Slovak ($44,229, a difference of 0.20%), South American Indian ($44,206, a difference of 0.25%), Scottish ($44,440, a difference of 0.27%), and Immigrants from Nepal ($44,187, a difference of 0.30%).
| Demographics | Rating | Rank | Per Capita Income |
| Immigrants | Armenia | 73.1 /100 | #148 | Good $44,552 |
| Koreans | 72.5 /100 | #149 | Good $44,522 |
| Immigrants | Eritrea | 72.1 /100 | #150 | Good $44,509 |
| Norwegians | 71.5 /100 | #151 | Good $44,480 |
| Peruvians | 71.5 /100 | #152 | Good $44,479 |
| Scottish | 70.6 /100 | #153 | Good $44,440 |
| Portuguese | 68.7 /100 | #154 | Good $44,362 |
| Uruguayans | 67.6 /100 | #155 | Good $44,318 |
| Slovaks | 65.4 /100 | #156 | Good $44,229 |
| South American Indians | 64.8 /100 | #157 | Good $44,206 |
| Immigrants | Nepal | 64.3 /100 | #158 | Good $44,187 |
| South Americans | 62.4 /100 | #159 | Good $44,114 |
| Danes | 61.9 /100 | #160 | Good $44,095 |
| Costa Ricans | 61.8 /100 | #161 | Good $44,090 |
| Swiss | 61.4 /100 | #162 | Good $44,076 |