Immigrants from Norway vs Uruguayan Per Capita Income
COMPARE
Immigrants from Norway
Uruguayan
Per Capita Income
Per Capita Income Comparison
Immigrants from Norway
Uruguayans
$52,217
PER CAPITA INCOME
100.0/ 100
METRIC RATING
32nd/ 347
METRIC RANK
$44,318
PER CAPITA INCOME
67.6/ 100
METRIC RATING
155th/ 347
METRIC RANK
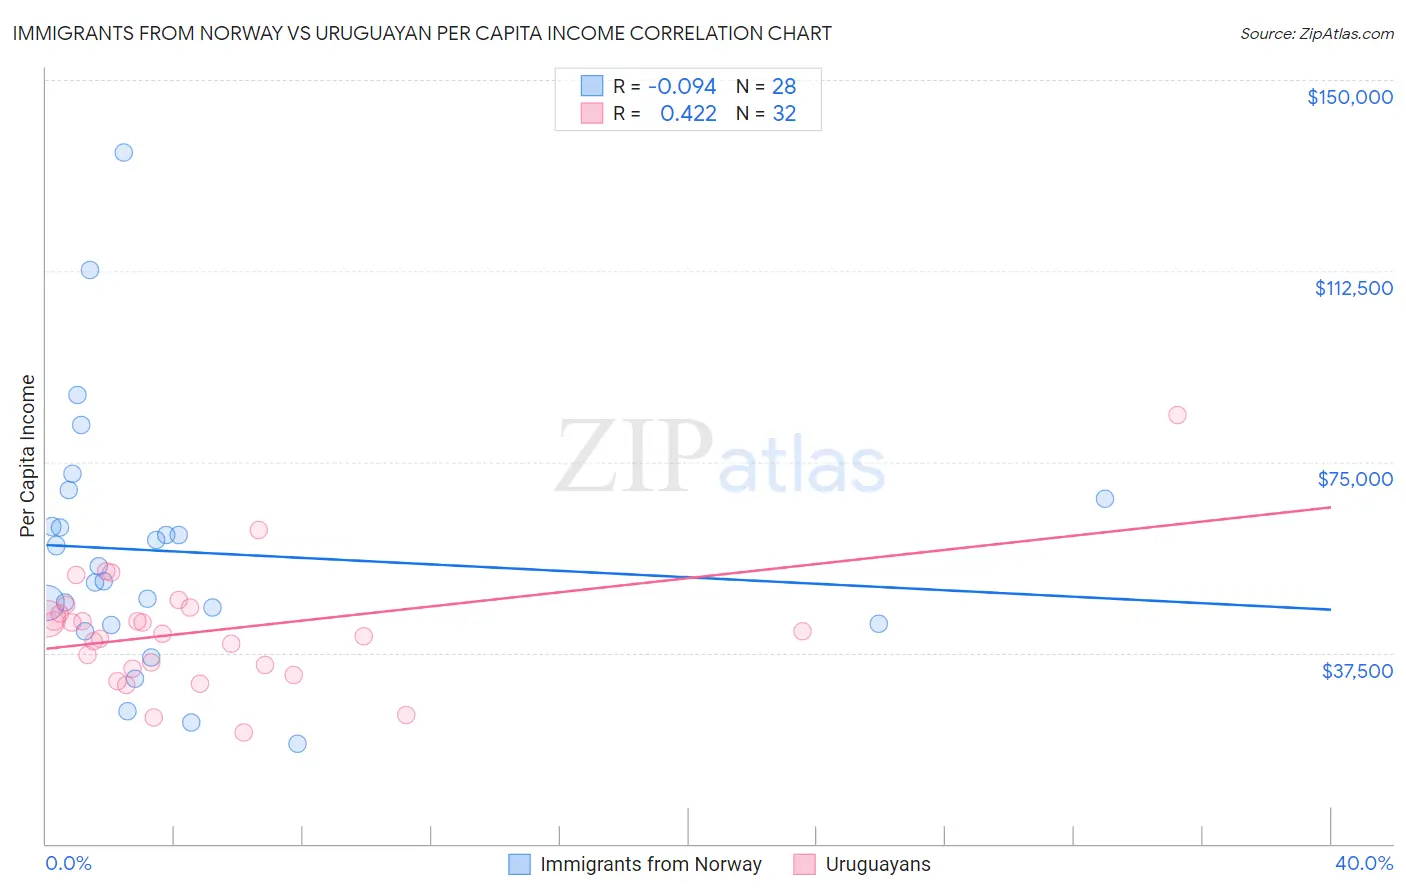
Immigrants from Norway vs Uruguayan Per Capita Income Correlation Chart
The statistical analysis conducted on geographies consisting of 116,714,031 people shows a slight negative correlation between the proportion of Immigrants from Norway and per capita income in the United States with a correlation coefficient (R) of -0.094 and weighted average of $52,217. Similarly, the statistical analysis conducted on geographies consisting of 144,785,218 people shows a moderate positive correlation between the proportion of Uruguayans and per capita income in the United States with a correlation coefficient (R) of 0.422 and weighted average of $44,318, a difference of 17.8%.
Per Capita Income Correlation Summary
| Measurement | Immigrants from Norway | Uruguayan |
| Minimum | $19,734 | $21,859 |
| Maximum | $135,828 | $84,313 |
| Range | $116,094 | $62,454 |
| Mean | $57,343 | $41,831 |
| Median | $53,027 | $41,436 |
| Interquartile 25% (IQ1) | $43,092 | $34,824 |
| Interquartile 75% (IQ3) | $65,016 | $45,774 |
| Interquartile Range (IQR) | $21,924 | $10,950 |
| Standard Deviation (Sample) | $25,135 | $11,692 |
| Standard Deviation (Population) | $24,682 | $11,508 |
Similar Demographics by Per Capita Income
Demographics Similar to Immigrants from Norway by Per Capita Income
In terms of per capita income, the demographic groups most similar to Immigrants from Norway are Australian ($52,074, a difference of 0.27%), Turkish ($52,391, a difference of 0.33%), Immigrants from Russia ($52,044, a difference of 0.33%), Burmese ($52,005, a difference of 0.41%), and Immigrants from Austria ($52,503, a difference of 0.55%).
| Demographics | Rating | Rank | Per Capita Income |
| Immigrants | Japan | 100.0 /100 | #25 | Exceptional $53,359 |
| Russians | 100.0 /100 | #26 | Exceptional $53,154 |
| Immigrants | South Central Asia | 100.0 /100 | #27 | Exceptional $52,660 |
| Latvians | 100.0 /100 | #28 | Exceptional $52,649 |
| Israelis | 100.0 /100 | #29 | Exceptional $52,596 |
| Immigrants | Austria | 100.0 /100 | #30 | Exceptional $52,503 |
| Turks | 100.0 /100 | #31 | Exceptional $52,391 |
| Immigrants | Norway | 100.0 /100 | #32 | Exceptional $52,217 |
| Australians | 100.0 /100 | #33 | Exceptional $52,074 |
| Immigrants | Russia | 100.0 /100 | #34 | Exceptional $52,044 |
| Burmese | 100.0 /100 | #35 | Exceptional $52,005 |
| Immigrants | Greece | 100.0 /100 | #36 | Exceptional $51,891 |
| Estonians | 100.0 /100 | #37 | Exceptional $51,875 |
| Immigrants | Czechoslovakia | 100.0 /100 | #38 | Exceptional $51,770 |
| Cambodians | 100.0 /100 | #39 | Exceptional $51,731 |
Demographics Similar to Uruguayans by Per Capita Income
In terms of per capita income, the demographic groups most similar to Uruguayans are Portuguese ($44,362, a difference of 0.10%), Slovak ($44,229, a difference of 0.20%), South American Indian ($44,206, a difference of 0.25%), Scottish ($44,440, a difference of 0.27%), and Immigrants from Nepal ($44,187, a difference of 0.30%).
| Demographics | Rating | Rank | Per Capita Income |
| Immigrants | Armenia | 73.1 /100 | #148 | Good $44,552 |
| Koreans | 72.5 /100 | #149 | Good $44,522 |
| Immigrants | Eritrea | 72.1 /100 | #150 | Good $44,509 |
| Norwegians | 71.5 /100 | #151 | Good $44,480 |
| Peruvians | 71.5 /100 | #152 | Good $44,479 |
| Scottish | 70.6 /100 | #153 | Good $44,440 |
| Portuguese | 68.7 /100 | #154 | Good $44,362 |
| Uruguayans | 67.6 /100 | #155 | Good $44,318 |
| Slovaks | 65.4 /100 | #156 | Good $44,229 |
| South American Indians | 64.8 /100 | #157 | Good $44,206 |
| Immigrants | Nepal | 64.3 /100 | #158 | Good $44,187 |
| South Americans | 62.4 /100 | #159 | Good $44,114 |
| Danes | 61.9 /100 | #160 | Good $44,095 |
| Costa Ricans | 61.8 /100 | #161 | Good $44,090 |
| Swiss | 61.4 /100 | #162 | Good $44,076 |