Alaska Native vs Uruguayan Per Capita Income
COMPARE
Alaska Native
Uruguayan
Per Capita Income
Per Capita Income Comparison
Alaska Natives
Uruguayans
$39,558
PER CAPITA INCOME
1.0/ 100
METRIC RATING
254th/ 347
METRIC RANK
$44,318
PER CAPITA INCOME
67.6/ 100
METRIC RATING
155th/ 347
METRIC RANK
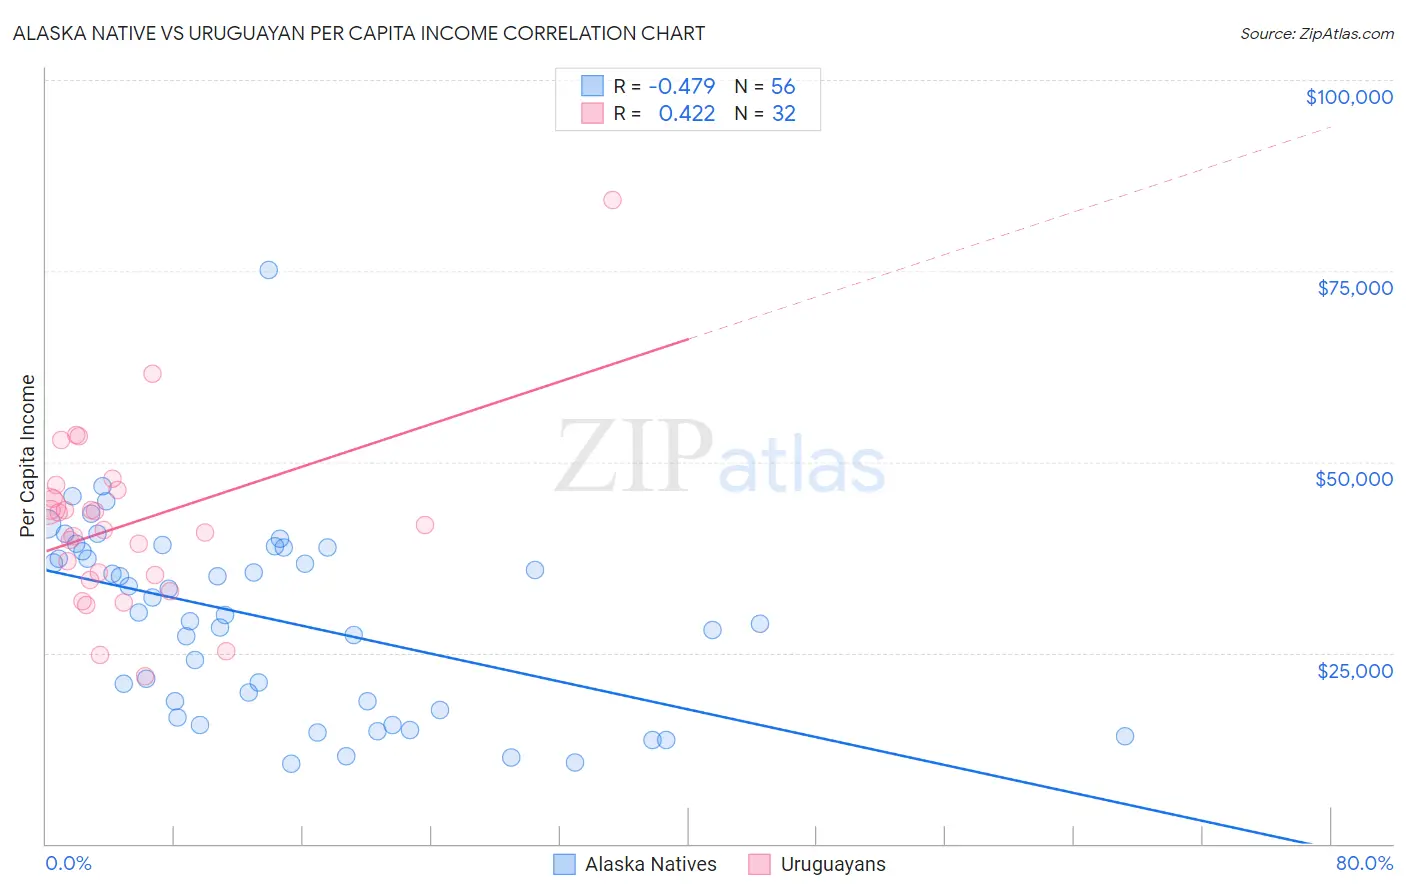
Alaska Native vs Uruguayan Per Capita Income Correlation Chart
The statistical analysis conducted on geographies consisting of 76,776,237 people shows a moderate negative correlation between the proportion of Alaska Natives and per capita income in the United States with a correlation coefficient (R) of -0.479 and weighted average of $39,558. Similarly, the statistical analysis conducted on geographies consisting of 144,785,218 people shows a moderate positive correlation between the proportion of Uruguayans and per capita income in the United States with a correlation coefficient (R) of 0.422 and weighted average of $44,318, a difference of 12.0%.
Per Capita Income Correlation Summary
| Measurement | Alaska Native | Uruguayan |
| Minimum | $10,456 | $21,859 |
| Maximum | $75,144 | $84,313 |
| Range | $64,688 | $62,454 |
| Mean | $29,356 | $41,831 |
| Median | $30,080 | $41,436 |
| Interquartile 25% (IQ1) | $18,080 | $34,824 |
| Interquartile 75% (IQ3) | $38,478 | $45,774 |
| Interquartile Range (IQR) | $20,399 | $10,950 |
| Standard Deviation (Sample) | $12,502 | $11,692 |
| Standard Deviation (Population) | $12,390 | $11,508 |
Similar Demographics by Per Capita Income
Demographics Similar to Alaska Natives by Per Capita Income
In terms of per capita income, the demographic groups most similar to Alaska Natives are Osage ($39,568, a difference of 0.020%), Immigrants from Middle Africa ($39,529, a difference of 0.070%), Immigrants from the Azores ($39,608, a difference of 0.13%), Hawaiian ($39,403, a difference of 0.39%), and Nicaraguan ($39,372, a difference of 0.47%).
| Demographics | Rating | Rank | Per Capita Income |
| Immigrants | Somalia | 1.6 /100 | #247 | Tragic $39,974 |
| Cape Verdeans | 1.5 /100 | #248 | Tragic $39,935 |
| Japanese | 1.4 /100 | #249 | Tragic $39,870 |
| Immigrants | Burma/Myanmar | 1.3 /100 | #250 | Tragic $39,827 |
| Samoans | 1.3 /100 | #251 | Tragic $39,826 |
| Immigrants | Azores | 1.0 /100 | #252 | Tragic $39,608 |
| Osage | 1.0 /100 | #253 | Tragic $39,568 |
| Alaska Natives | 1.0 /100 | #254 | Tragic $39,558 |
| Immigrants | Middle Africa | 1.0 /100 | #255 | Tragic $39,529 |
| Hawaiians | 0.8 /100 | #256 | Tragic $39,403 |
| Nicaraguans | 0.8 /100 | #257 | Tragic $39,372 |
| Jamaicans | 0.7 /100 | #258 | Tragic $39,231 |
| Malaysians | 0.7 /100 | #259 | Tragic $39,194 |
| Alaskan Athabascans | 0.6 /100 | #260 | Tragic $39,163 |
| Marshallese | 0.6 /100 | #261 | Tragic $39,108 |
Demographics Similar to Uruguayans by Per Capita Income
In terms of per capita income, the demographic groups most similar to Uruguayans are Portuguese ($44,362, a difference of 0.10%), Slovak ($44,229, a difference of 0.20%), South American Indian ($44,206, a difference of 0.25%), Scottish ($44,440, a difference of 0.27%), and Immigrants from Nepal ($44,187, a difference of 0.30%).
| Demographics | Rating | Rank | Per Capita Income |
| Immigrants | Armenia | 73.1 /100 | #148 | Good $44,552 |
| Koreans | 72.5 /100 | #149 | Good $44,522 |
| Immigrants | Eritrea | 72.1 /100 | #150 | Good $44,509 |
| Norwegians | 71.5 /100 | #151 | Good $44,480 |
| Peruvians | 71.5 /100 | #152 | Good $44,479 |
| Scottish | 70.6 /100 | #153 | Good $44,440 |
| Portuguese | 68.7 /100 | #154 | Good $44,362 |
| Uruguayans | 67.6 /100 | #155 | Good $44,318 |
| Slovaks | 65.4 /100 | #156 | Good $44,229 |
| South American Indians | 64.8 /100 | #157 | Good $44,206 |
| Immigrants | Nepal | 64.3 /100 | #158 | Good $44,187 |
| South Americans | 62.4 /100 | #159 | Good $44,114 |
| Danes | 61.9 /100 | #160 | Good $44,095 |
| Costa Ricans | 61.8 /100 | #161 | Good $44,090 |
| Swiss | 61.4 /100 | #162 | Good $44,076 |