Icelander vs Sri Lankan Per Capita Income
COMPARE
Icelander
Sri Lankan
Per Capita Income
Per Capita Income Comparison
Icelanders
Sri Lankans
$44,987
PER CAPITA INCOME
81.6/ 100
METRIC RATING
144th/ 347
METRIC RANK
$44,014
PER CAPITA INCOME
59.8/ 100
METRIC RATING
164th/ 347
METRIC RANK
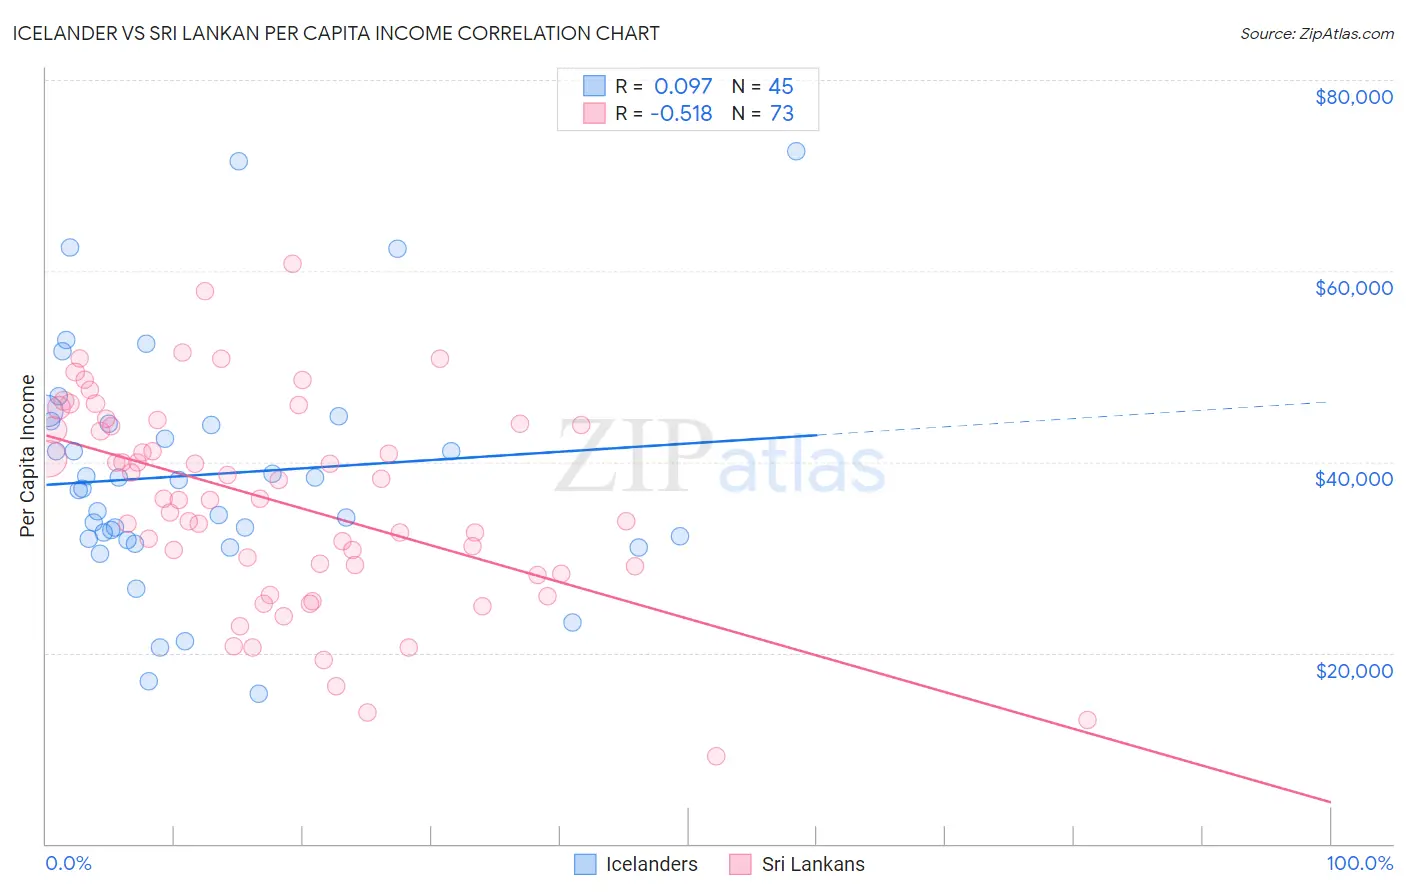
Icelander vs Sri Lankan Per Capita Income Correlation Chart
The statistical analysis conducted on geographies consisting of 159,668,759 people shows a slight positive correlation between the proportion of Icelanders and per capita income in the United States with a correlation coefficient (R) of 0.097 and weighted average of $44,987. Similarly, the statistical analysis conducted on geographies consisting of 440,642,250 people shows a substantial negative correlation between the proportion of Sri Lankans and per capita income in the United States with a correlation coefficient (R) of -0.518 and weighted average of $44,014, a difference of 2.2%.
Per Capita Income Correlation Summary
| Measurement | Icelander | Sri Lankan |
| Minimum | $15,711 | $9,224 |
| Maximum | $72,483 | $60,722 |
| Range | $56,772 | $51,498 |
| Mean | $38,667 | $35,781 |
| Median | $37,248 | $36,115 |
| Interquartile 25% (IQ1) | $31,880 | $28,668 |
| Interquartile 75% (IQ3) | $44,123 | $43,934 |
| Interquartile Range (IQR) | $12,243 | $15,265 |
| Standard Deviation (Sample) | $12,398 | $10,742 |
| Standard Deviation (Population) | $12,260 | $10,669 |
Demographics Similar to Icelanders and Sri Lankans by Per Capita Income
In terms of per capita income, the demographic groups most similar to Icelanders are Immigrants from Afghanistan ($44,790, a difference of 0.44%), Irish ($44,679, a difference of 0.69%), Czech ($44,595, a difference of 0.88%), Immigrants from Armenia ($44,552, a difference of 0.98%), and Korean ($44,522, a difference of 1.0%). Similarly, the demographic groups most similar to Sri Lankans are Immigrants from South America ($44,068, a difference of 0.12%), Swiss ($44,076, a difference of 0.14%), Costa Rican ($44,090, a difference of 0.17%), Danish ($44,095, a difference of 0.18%), and South American ($44,114, a difference of 0.23%).
| Demographics | Rating | Rank | Per Capita Income |
| Icelanders | 81.6 /100 | #144 | Excellent $44,987 |
| Immigrants | Afghanistan | 78.0 /100 | #145 | Good $44,790 |
| Irish | 75.8 /100 | #146 | Good $44,679 |
| Czechs | 74.1 /100 | #147 | Good $44,595 |
| Immigrants | Armenia | 73.1 /100 | #148 | Good $44,552 |
| Koreans | 72.5 /100 | #149 | Good $44,522 |
| Immigrants | Eritrea | 72.1 /100 | #150 | Good $44,509 |
| Norwegians | 71.5 /100 | #151 | Good $44,480 |
| Peruvians | 71.5 /100 | #152 | Good $44,479 |
| Scottish | 70.6 /100 | #153 | Good $44,440 |
| Portuguese | 68.7 /100 | #154 | Good $44,362 |
| Uruguayans | 67.6 /100 | #155 | Good $44,318 |
| Slovaks | 65.4 /100 | #156 | Good $44,229 |
| South American Indians | 64.8 /100 | #157 | Good $44,206 |
| Immigrants | Nepal | 64.3 /100 | #158 | Good $44,187 |
| South Americans | 62.4 /100 | #159 | Good $44,114 |
| Danes | 61.9 /100 | #160 | Good $44,095 |
| Costa Ricans | 61.8 /100 | #161 | Good $44,090 |
| Swiss | 61.4 /100 | #162 | Good $44,076 |
| Immigrants | South America | 61.2 /100 | #163 | Good $44,068 |
| Sri Lankans | 59.8 /100 | #164 | Average $44,014 |