Immigrants from Bolivia vs Uruguayan Per Capita Income
COMPARE
Immigrants from Bolivia
Uruguayan
Per Capita Income
Per Capita Income Comparison
Immigrants from Bolivia
Uruguayans
$48,970
PER CAPITA INCOME
99.7/ 100
METRIC RATING
75th/ 347
METRIC RANK
$44,318
PER CAPITA INCOME
67.6/ 100
METRIC RATING
155th/ 347
METRIC RANK
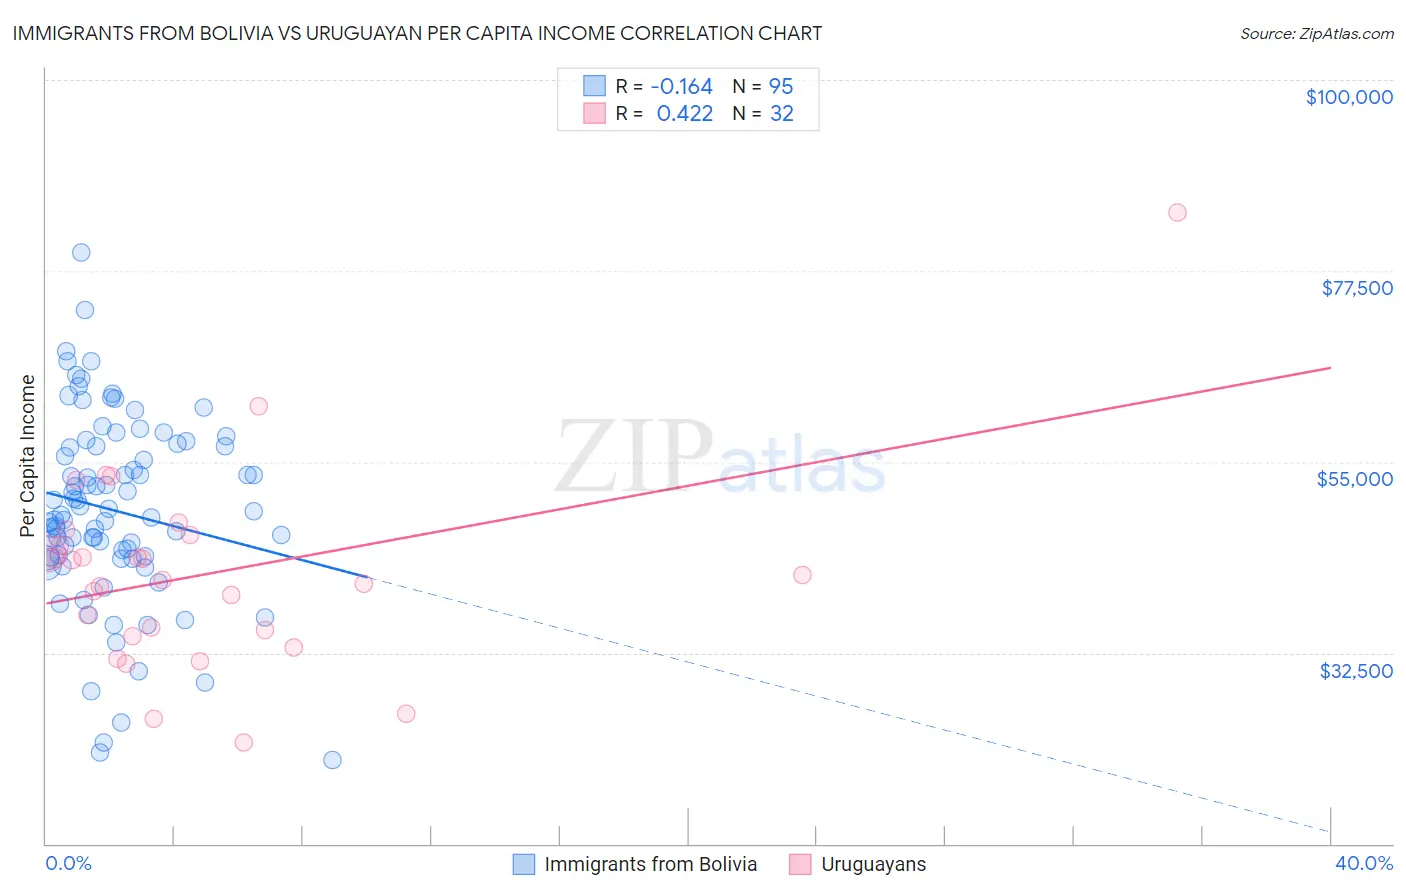
Immigrants from Bolivia vs Uruguayan Per Capita Income Correlation Chart
The statistical analysis conducted on geographies consisting of 158,726,155 people shows a poor negative correlation between the proportion of Immigrants from Bolivia and per capita income in the United States with a correlation coefficient (R) of -0.164 and weighted average of $48,970. Similarly, the statistical analysis conducted on geographies consisting of 144,785,218 people shows a moderate positive correlation between the proportion of Uruguayans and per capita income in the United States with a correlation coefficient (R) of 0.422 and weighted average of $44,318, a difference of 10.5%.
Per Capita Income Correlation Summary
| Measurement | Immigrants from Bolivia | Uruguayan |
| Minimum | $19,857 | $21,859 |
| Maximum | $79,655 | $84,313 |
| Range | $59,798 | $62,454 |
| Mean | $49,279 | $41,831 |
| Median | $48,688 | $41,436 |
| Interquartile 25% (IQ1) | $43,768 | $34,824 |
| Interquartile 75% (IQ3) | $56,811 | $45,774 |
| Interquartile Range (IQR) | $13,042 | $10,950 |
| Standard Deviation (Sample) | $11,114 | $11,692 |
| Standard Deviation (Population) | $11,056 | $11,508 |
Similar Demographics by Per Capita Income
Demographics Similar to Immigrants from Bolivia by Per Capita Income
In terms of per capita income, the demographic groups most similar to Immigrants from Bolivia are Immigrants from England ($48,844, a difference of 0.26%), Mongolian ($49,173, a difference of 0.41%), Immigrants from Kazakhstan ($48,747, a difference of 0.46%), Immigrants from Italy ($48,654, a difference of 0.65%), and Immigrants from Hungary ($49,303, a difference of 0.68%).
| Demographics | Rating | Rank | Per Capita Income |
| Lithuanians | 99.8 /100 | #68 | Exceptional $49,448 |
| Immigrants | Canada | 99.8 /100 | #69 | Exceptional $49,412 |
| Immigrants | Eastern Europe | 99.8 /100 | #70 | Exceptional $49,316 |
| Greeks | 99.8 /100 | #71 | Exceptional $49,309 |
| Immigrants | Hungary | 99.8 /100 | #72 | Exceptional $49,303 |
| Immigrants | North America | 99.8 /100 | #73 | Exceptional $49,302 |
| Mongolians | 99.8 /100 | #74 | Exceptional $49,173 |
| Immigrants | Bolivia | 99.7 /100 | #75 | Exceptional $48,970 |
| Immigrants | England | 99.7 /100 | #76 | Exceptional $48,844 |
| Immigrants | Kazakhstan | 99.7 /100 | #77 | Exceptional $48,747 |
| Immigrants | Italy | 99.6 /100 | #78 | Exceptional $48,654 |
| Romanians | 99.5 /100 | #79 | Exceptional $48,445 |
| Egyptians | 99.5 /100 | #80 | Exceptional $48,358 |
| Armenians | 99.4 /100 | #81 | Exceptional $48,287 |
| Immigrants | Indonesia | 99.4 /100 | #82 | Exceptional $48,195 |
Demographics Similar to Uruguayans by Per Capita Income
In terms of per capita income, the demographic groups most similar to Uruguayans are Portuguese ($44,362, a difference of 0.10%), Slovak ($44,229, a difference of 0.20%), South American Indian ($44,206, a difference of 0.25%), Scottish ($44,440, a difference of 0.27%), and Immigrants from Nepal ($44,187, a difference of 0.30%).
| Demographics | Rating | Rank | Per Capita Income |
| Immigrants | Armenia | 73.1 /100 | #148 | Good $44,552 |
| Koreans | 72.5 /100 | #149 | Good $44,522 |
| Immigrants | Eritrea | 72.1 /100 | #150 | Good $44,509 |
| Norwegians | 71.5 /100 | #151 | Good $44,480 |
| Peruvians | 71.5 /100 | #152 | Good $44,479 |
| Scottish | 70.6 /100 | #153 | Good $44,440 |
| Portuguese | 68.7 /100 | #154 | Good $44,362 |
| Uruguayans | 67.6 /100 | #155 | Good $44,318 |
| Slovaks | 65.4 /100 | #156 | Good $44,229 |
| South American Indians | 64.8 /100 | #157 | Good $44,206 |
| Immigrants | Nepal | 64.3 /100 | #158 | Good $44,187 |
| South Americans | 62.4 /100 | #159 | Good $44,114 |
| Danes | 61.9 /100 | #160 | Good $44,095 |
| Costa Ricans | 61.8 /100 | #161 | Good $44,090 |
| Swiss | 61.4 /100 | #162 | Good $44,076 |