Icelander vs Shoshone Median Earnings
COMPARE
Icelander
Shoshone
Median Earnings
Median Earnings Comparison
Icelanders
Shoshone
$46,916
MEDIAN EARNINGS
66.3/ 100
METRIC RATING
163rd/ 347
METRIC RANK
$40,932
MEDIAN EARNINGS
0.0/ 100
METRIC RATING
302nd/ 347
METRIC RANK
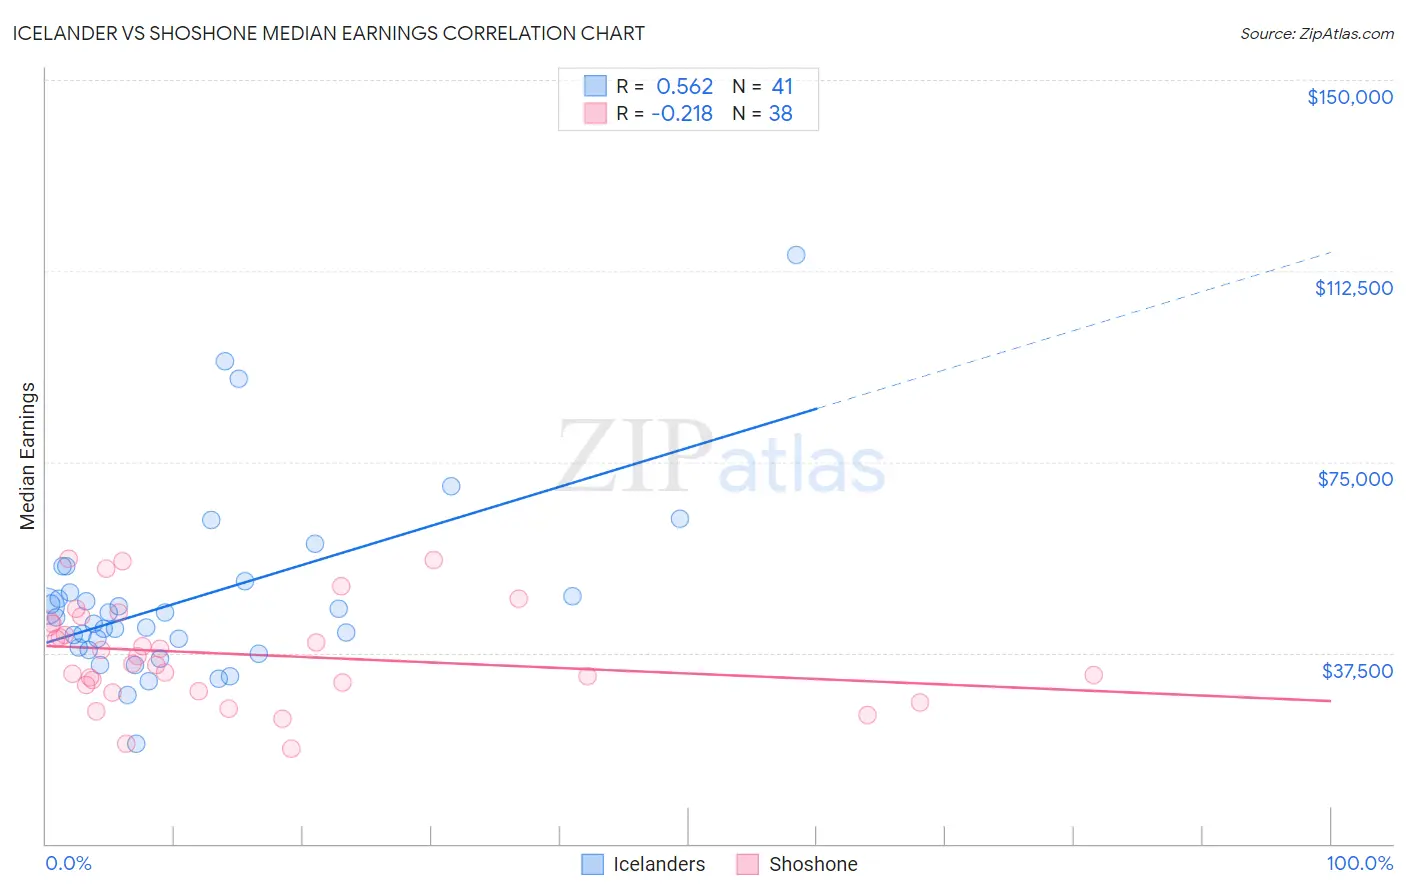
Icelander vs Shoshone Median Earnings Correlation Chart
The statistical analysis conducted on geographies consisting of 159,666,599 people shows a substantial positive correlation between the proportion of Icelanders and median earnings in the United States with a correlation coefficient (R) of 0.562 and weighted average of $46,916. Similarly, the statistical analysis conducted on geographies consisting of 66,619,980 people shows a weak negative correlation between the proportion of Shoshone and median earnings in the United States with a correlation coefficient (R) of -0.218 and weighted average of $40,932, a difference of 14.6%.
Median Earnings Correlation Summary
| Measurement | Icelander | Shoshone |
| Minimum | $19,583 | $18,625 |
| Maximum | $115,625 | $56,007 |
| Range | $96,042 | $37,382 |
| Mean | $48,186 | $37,253 |
| Median | $44,536 | $36,104 |
| Interquartile 25% (IQ1) | $38,407 | $31,272 |
| Interquartile 75% (IQ3) | $50,498 | $43,286 |
| Interquartile Range (IQR) | $12,091 | $12,015 |
| Standard Deviation (Sample) | $17,953 | $9,755 |
| Standard Deviation (Population) | $17,732 | $9,625 |
Similar Demographics by Median Earnings
Demographics Similar to Icelanders by Median Earnings
In terms of median earnings, the demographic groups most similar to Icelanders are South American Indian ($46,952, a difference of 0.080%), Immigrants from Eastern Africa ($46,969, a difference of 0.11%), Norwegian ($46,865, a difference of 0.11%), Immigrants from Peru ($47,025, a difference of 0.23%), and Alsatian ($47,023, a difference of 0.23%).
| Demographics | Rating | Rank | Median Earnings |
| Irish | 76.6 /100 | #156 | Good $47,276 |
| Czechs | 75.1 /100 | #157 | Good $47,221 |
| Slovaks | 71.7 /100 | #158 | Good $47,095 |
| Immigrants | Peru | 69.6 /100 | #159 | Good $47,025 |
| Alsatians | 69.6 /100 | #160 | Good $47,023 |
| Immigrants | Eastern Africa | 68.0 /100 | #161 | Good $46,969 |
| South American Indians | 67.4 /100 | #162 | Good $46,952 |
| Icelanders | 66.3 /100 | #163 | Good $46,916 |
| Norwegians | 64.7 /100 | #164 | Good $46,865 |
| South Americans | 62.7 /100 | #165 | Good $46,804 |
| Czechoslovakians | 57.8 /100 | #166 | Average $46,658 |
| Costa Ricans | 57.4 /100 | #167 | Average $46,645 |
| Immigrants | Africa | 54.6 /100 | #168 | Average $46,564 |
| Immigrants | South America | 54.0 /100 | #169 | Average $46,548 |
| Immigrants | Immigrants | 51.6 /100 | #170 | Average $46,478 |
Demographics Similar to Shoshone by Median Earnings
In terms of median earnings, the demographic groups most similar to Shoshone are Haitian ($40,918, a difference of 0.030%), Immigrants from Guatemala ($40,851, a difference of 0.20%), Ute ($41,051, a difference of 0.29%), Immigrants from Latin America ($41,049, a difference of 0.29%), and Immigrants from Caribbean ($41,119, a difference of 0.46%).
| Demographics | Rating | Rank | Median Earnings |
| Bangladeshis | 0.1 /100 | #295 | Tragic $41,263 |
| Cherokee | 0.1 /100 | #296 | Tragic $41,252 |
| Guatemalans | 0.1 /100 | #297 | Tragic $41,205 |
| Immigrants | Micronesia | 0.1 /100 | #298 | Tragic $41,133 |
| Immigrants | Caribbean | 0.1 /100 | #299 | Tragic $41,119 |
| Ute | 0.1 /100 | #300 | Tragic $41,051 |
| Immigrants | Latin America | 0.1 /100 | #301 | Tragic $41,049 |
| Shoshone | 0.0 /100 | #302 | Tragic $40,932 |
| Haitians | 0.0 /100 | #303 | Tragic $40,918 |
| Immigrants | Guatemala | 0.0 /100 | #304 | Tragic $40,851 |
| Chickasaw | 0.0 /100 | #305 | Tragic $40,672 |
| Yaqui | 0.0 /100 | #306 | Tragic $40,647 |
| Hondurans | 0.0 /100 | #307 | Tragic $40,638 |
| Cubans | 0.0 /100 | #308 | Tragic $40,619 |
| Immigrants | Haiti | 0.0 /100 | #309 | Tragic $40,550 |