Venezuelan vs Kenyan Median Female Earnings
COMPARE
Venezuelan
Kenyan
Median Female Earnings
Median Female Earnings Comparison
Venezuelans
Kenyans
$37,282
MEDIAN FEMALE EARNINGS
0.7/ 100
METRIC RATING
262nd/ 347
METRIC RANK
$39,860
MEDIAN FEMALE EARNINGS
58.4/ 100
METRIC RATING
169th/ 347
METRIC RANK
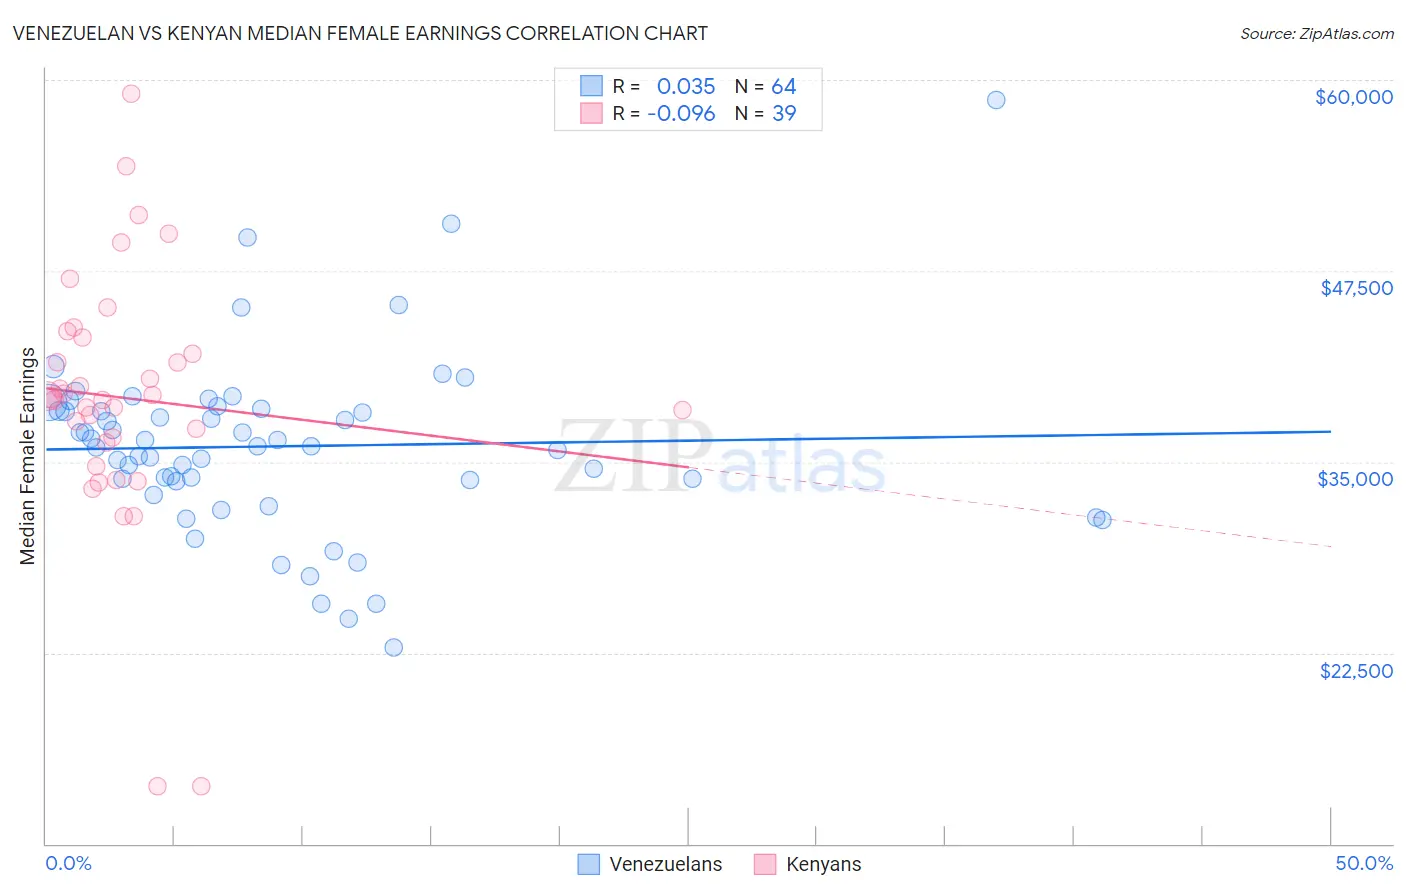
Venezuelan vs Kenyan Median Female Earnings Correlation Chart
The statistical analysis conducted on geographies consisting of 306,258,851 people shows no correlation between the proportion of Venezuelans and median female earnings in the United States with a correlation coefficient (R) of 0.035 and weighted average of $37,282. Similarly, the statistical analysis conducted on geographies consisting of 168,237,877 people shows a slight negative correlation between the proportion of Kenyans and median female earnings in the United States with a correlation coefficient (R) of -0.096 and weighted average of $39,860, a difference of 6.9%.
Median Female Earnings Correlation Summary
| Measurement | Venezuelan | Kenyan |
| Minimum | $22,864 | $13,750 |
| Maximum | $58,709 | $59,125 |
| Range | $35,845 | $45,375 |
| Mean | $36,013 | $39,183 |
| Median | $36,008 | $39,212 |
| Interquartile 25% (IQ1) | $33,765 | $36,279 |
| Interquartile 75% (IQ3) | $38,398 | $43,131 |
| Interquartile Range (IQR) | $4,633 | $6,851 |
| Standard Deviation (Sample) | $5,910 | $8,498 |
| Standard Deviation (Population) | $5,863 | $8,388 |
Similar Demographics by Median Female Earnings
Demographics Similar to Venezuelans by Median Female Earnings
In terms of median female earnings, the demographic groups most similar to Venezuelans are Malaysian ($37,298, a difference of 0.040%), Dutch ($37,339, a difference of 0.15%), Scotch-Irish ($37,383, a difference of 0.27%), Belizean ($37,429, a difference of 0.39%), and German Russian ($37,105, a difference of 0.48%).
| Demographics | Rating | Rank | Median Female Earnings |
| Colville | 1.1 /100 | #255 | Tragic $37,514 |
| Samoans | 1.0 /100 | #256 | Tragic $37,498 |
| Hawaiians | 1.0 /100 | #257 | Tragic $37,497 |
| Belizeans | 0.9 /100 | #258 | Tragic $37,429 |
| Scotch-Irish | 0.8 /100 | #259 | Tragic $37,383 |
| Dutch | 0.7 /100 | #260 | Tragic $37,339 |
| Malaysians | 0.7 /100 | #261 | Tragic $37,298 |
| Venezuelans | 0.7 /100 | #262 | Tragic $37,282 |
| German Russians | 0.5 /100 | #263 | Tragic $37,105 |
| Salvadorans | 0.4 /100 | #264 | Tragic $37,083 |
| Immigrants | Belize | 0.4 /100 | #265 | Tragic $37,056 |
| Dominicans | 0.4 /100 | #266 | Tragic $37,046 |
| Immigrants | Nonimmigrants | 0.4 /100 | #267 | Tragic $37,024 |
| Cree | 0.4 /100 | #268 | Tragic $37,018 |
| Immigrants | Venezuela | 0.4 /100 | #269 | Tragic $37,003 |
Demographics Similar to Kenyans by Median Female Earnings
In terms of median female earnings, the demographic groups most similar to Kenyans are Immigrants from Peru ($39,871, a difference of 0.030%), Immigrants from Ghana ($39,894, a difference of 0.080%), Luxembourger ($39,891, a difference of 0.080%), Slovene ($39,817, a difference of 0.11%), and Immigrants from Bangladesh ($39,910, a difference of 0.12%).
| Demographics | Rating | Rank | Median Female Earnings |
| South American Indians | 66.1 /100 | #162 | Good $40,019 |
| Lebanese | 65.5 /100 | #163 | Good $40,006 |
| Immigrants | Saudi Arabia | 62.9 /100 | #164 | Good $39,952 |
| Immigrants | Bangladesh | 60.8 /100 | #165 | Good $39,910 |
| Immigrants | Ghana | 60.0 /100 | #166 | Good $39,894 |
| Luxembourgers | 59.9 /100 | #167 | Average $39,891 |
| Immigrants | Peru | 58.9 /100 | #168 | Average $39,871 |
| Kenyans | 58.4 /100 | #169 | Average $39,860 |
| Slovenes | 56.2 /100 | #170 | Average $39,817 |
| Immigrants | Portugal | 54.7 /100 | #171 | Average $39,788 |
| British | 53.8 /100 | #172 | Average $39,772 |
| Canadians | 51.4 /100 | #173 | Average $39,724 |
| South Americans | 50.0 /100 | #174 | Average $39,698 |
| Immigrants | South America | 47.2 /100 | #175 | Average $39,643 |
| Nigerians | 47.0 /100 | #176 | Average $39,641 |