Immigrants from Iran vs Kenyan Median Female Earnings
COMPARE
Immigrants from Iran
Kenyan
Median Female Earnings
Median Female Earnings Comparison
Immigrants from Iran
Kenyans
$47,154
MEDIAN FEMALE EARNINGS
100.0/ 100
METRIC RATING
9th/ 347
METRIC RANK
$39,860
MEDIAN FEMALE EARNINGS
58.4/ 100
METRIC RATING
169th/ 347
METRIC RANK
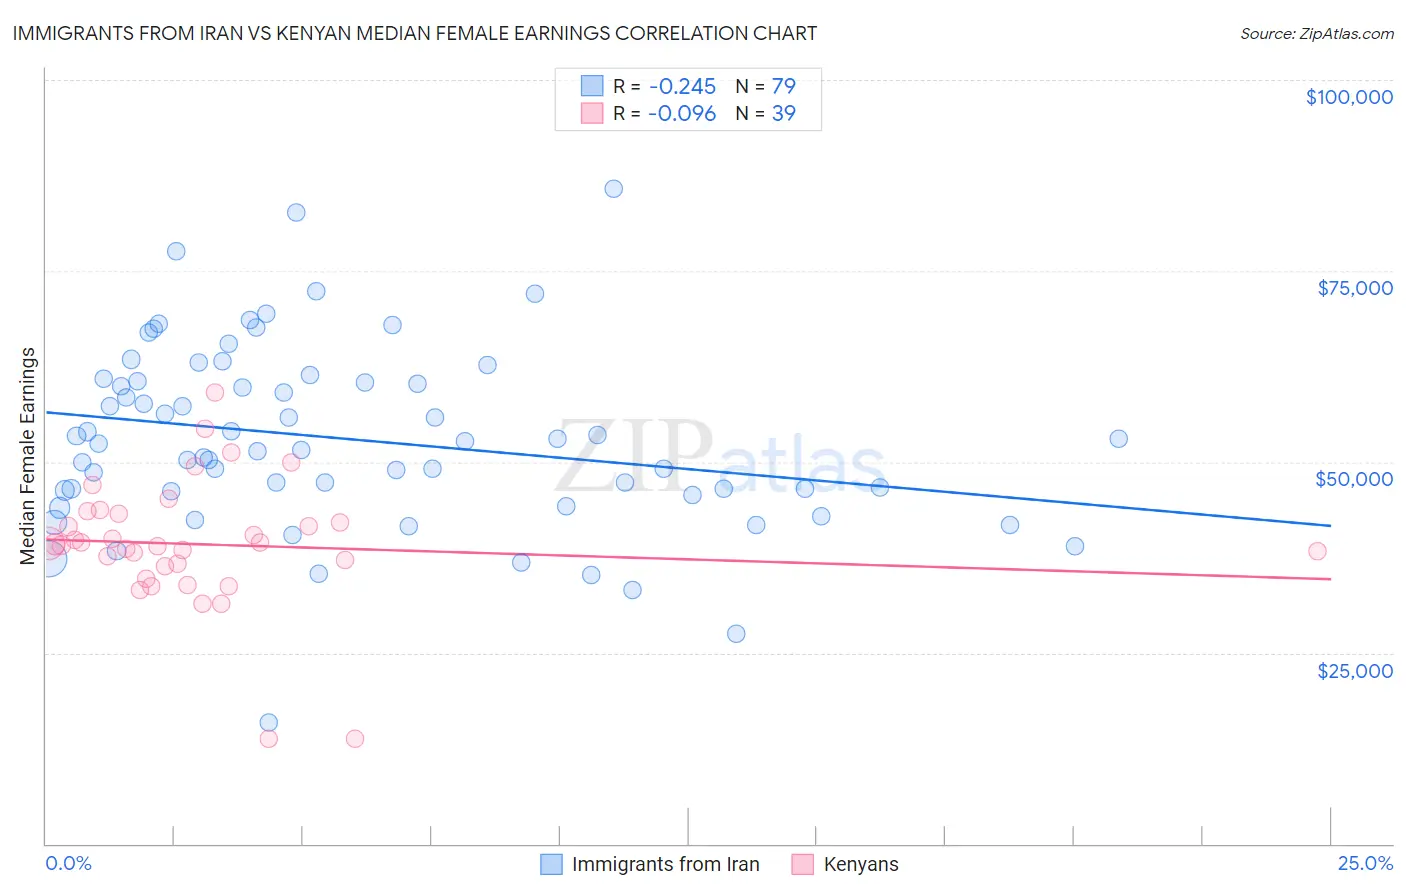
Immigrants from Iran vs Kenyan Median Female Earnings Correlation Chart
The statistical analysis conducted on geographies consisting of 279,791,483 people shows a weak negative correlation between the proportion of Immigrants from Iran and median female earnings in the United States with a correlation coefficient (R) of -0.245 and weighted average of $47,154. Similarly, the statistical analysis conducted on geographies consisting of 168,237,877 people shows a slight negative correlation between the proportion of Kenyans and median female earnings in the United States with a correlation coefficient (R) of -0.096 and weighted average of $39,860, a difference of 18.3%.
Median Female Earnings Correlation Summary
| Measurement | Immigrants from Iran | Kenyan |
| Minimum | $15,864 | $13,750 |
| Maximum | $85,822 | $59,125 |
| Range | $69,958 | $45,375 |
| Mean | $52,976 | $39,183 |
| Median | $52,367 | $39,212 |
| Interquartile 25% (IQ1) | $46,131 | $36,279 |
| Interquartile 75% (IQ3) | $60,507 | $43,131 |
| Interquartile Range (IQR) | $14,376 | $6,851 |
| Standard Deviation (Sample) | $12,151 | $8,498 |
| Standard Deviation (Population) | $12,074 | $8,388 |
Similar Demographics by Median Female Earnings
Demographics Similar to Immigrants from Iran by Median Female Earnings
In terms of median female earnings, the demographic groups most similar to Immigrants from Iran are Immigrants from China ($46,972, a difference of 0.39%), Okinawan ($46,905, a difference of 0.53%), Immigrants from Israel ($46,902, a difference of 0.54%), Iranian ($47,421, a difference of 0.57%), and Thai ($47,577, a difference of 0.90%).
| Demographics | Rating | Rank | Median Female Earnings |
| Filipinos | 100.0 /100 | #2 | Exceptional $49,508 |
| Immigrants | Taiwan | 100.0 /100 | #3 | Exceptional $49,256 |
| Immigrants | India | 100.0 /100 | #4 | Exceptional $48,292 |
| Immigrants | Singapore | 100.0 /100 | #5 | Exceptional $47,986 |
| Immigrants | Ireland | 100.0 /100 | #6 | Exceptional $47,598 |
| Thais | 100.0 /100 | #7 | Exceptional $47,577 |
| Iranians | 100.0 /100 | #8 | Exceptional $47,421 |
| Immigrants | Iran | 100.0 /100 | #9 | Exceptional $47,154 |
| Immigrants | China | 100.0 /100 | #10 | Exceptional $46,972 |
| Okinawans | 100.0 /100 | #11 | Exceptional $46,905 |
| Immigrants | Israel | 100.0 /100 | #12 | Exceptional $46,902 |
| Immigrants | Australia | 100.0 /100 | #13 | Exceptional $46,573 |
| Soviet Union | 100.0 /100 | #14 | Exceptional $46,556 |
| Immigrants | Eastern Asia | 100.0 /100 | #15 | Exceptional $46,502 |
| Indians (Asian) | 100.0 /100 | #16 | Exceptional $46,481 |
Demographics Similar to Kenyans by Median Female Earnings
In terms of median female earnings, the demographic groups most similar to Kenyans are Immigrants from Peru ($39,871, a difference of 0.030%), Immigrants from Ghana ($39,894, a difference of 0.080%), Luxembourger ($39,891, a difference of 0.080%), Slovene ($39,817, a difference of 0.11%), and Immigrants from Bangladesh ($39,910, a difference of 0.12%).
| Demographics | Rating | Rank | Median Female Earnings |
| South American Indians | 66.1 /100 | #162 | Good $40,019 |
| Lebanese | 65.5 /100 | #163 | Good $40,006 |
| Immigrants | Saudi Arabia | 62.9 /100 | #164 | Good $39,952 |
| Immigrants | Bangladesh | 60.8 /100 | #165 | Good $39,910 |
| Immigrants | Ghana | 60.0 /100 | #166 | Good $39,894 |
| Luxembourgers | 59.9 /100 | #167 | Average $39,891 |
| Immigrants | Peru | 58.9 /100 | #168 | Average $39,871 |
| Kenyans | 58.4 /100 | #169 | Average $39,860 |
| Slovenes | 56.2 /100 | #170 | Average $39,817 |
| Immigrants | Portugal | 54.7 /100 | #171 | Average $39,788 |
| British | 53.8 /100 | #172 | Average $39,772 |
| Canadians | 51.4 /100 | #173 | Average $39,724 |
| South Americans | 50.0 /100 | #174 | Average $39,698 |
| Immigrants | South America | 47.2 /100 | #175 | Average $39,643 |
| Nigerians | 47.0 /100 | #176 | Average $39,641 |