Immigrants from West Indies vs Kenyan Median Female Earnings
COMPARE
Immigrants from West Indies
Kenyan
Median Female Earnings
Median Female Earnings Comparison
Immigrants from West Indies
Kenyans
$39,441
MEDIAN FEMALE EARNINGS
36.9/ 100
METRIC RATING
185th/ 347
METRIC RANK
$39,860
MEDIAN FEMALE EARNINGS
58.4/ 100
METRIC RATING
169th/ 347
METRIC RANK
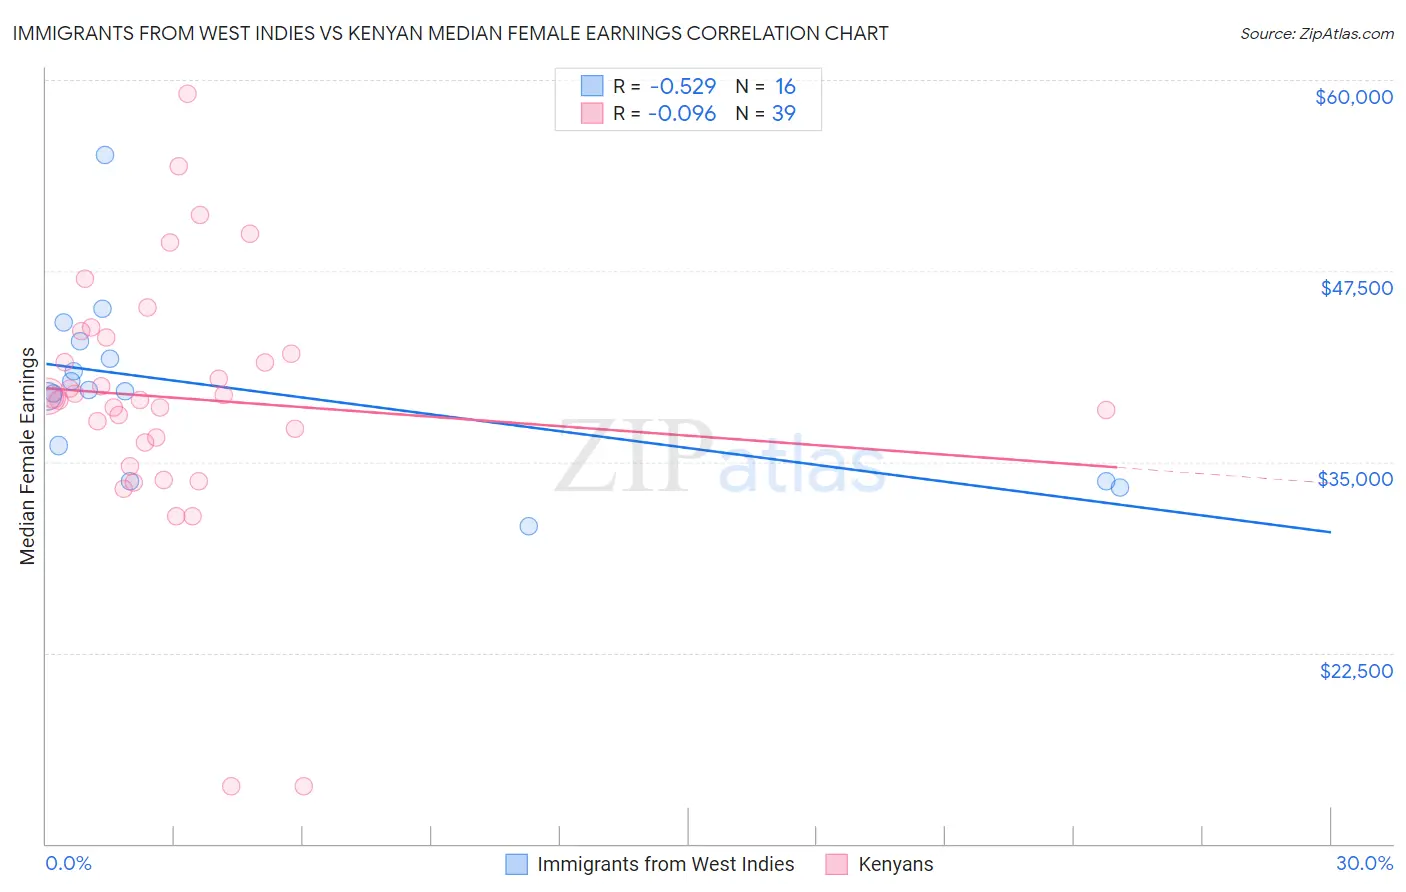
Immigrants from West Indies vs Kenyan Median Female Earnings Correlation Chart
The statistical analysis conducted on geographies consisting of 72,414,276 people shows a substantial negative correlation between the proportion of Immigrants from West Indies and median female earnings in the United States with a correlation coefficient (R) of -0.529 and weighted average of $39,441. Similarly, the statistical analysis conducted on geographies consisting of 168,237,877 people shows a slight negative correlation between the proportion of Kenyans and median female earnings in the United States with a correlation coefficient (R) of -0.096 and weighted average of $39,860, a difference of 1.1%.
Median Female Earnings Correlation Summary
| Measurement | Immigrants from West Indies | Kenyan |
| Minimum | $30,781 | $13,750 |
| Maximum | $55,116 | $59,125 |
| Range | $24,335 | $45,375 |
| Mean | $39,738 | $39,183 |
| Median | $39,670 | $39,212 |
| Interquartile 25% (IQ1) | $34,901 | $36,279 |
| Interquartile 75% (IQ3) | $42,316 | $43,131 |
| Interquartile Range (IQR) | $7,415 | $6,851 |
| Standard Deviation (Sample) | $5,811 | $8,498 |
| Standard Deviation (Population) | $5,627 | $8,388 |
Demographics Similar to Immigrants from West Indies and Kenyans by Median Female Earnings
In terms of median female earnings, the demographic groups most similar to Immigrants from West Indies are Colombian ($39,439, a difference of 0.0%), European ($39,457, a difference of 0.040%), Swedish ($39,421, a difference of 0.050%), Tlingit-Haida ($39,513, a difference of 0.18%), and Hungarian ($39,510, a difference of 0.18%). Similarly, the demographic groups most similar to Kenyans are Immigrants from Peru ($39,871, a difference of 0.030%), Luxembourger ($39,891, a difference of 0.080%), Slovene ($39,817, a difference of 0.11%), Immigrants from Portugal ($39,788, a difference of 0.18%), and British ($39,772, a difference of 0.22%).
| Demographics | Rating | Rank | Median Female Earnings |
| Luxembourgers | 59.9 /100 | #167 | Average $39,891 |
| Immigrants | Peru | 58.9 /100 | #168 | Average $39,871 |
| Kenyans | 58.4 /100 | #169 | Average $39,860 |
| Slovenes | 56.2 /100 | #170 | Average $39,817 |
| Immigrants | Portugal | 54.7 /100 | #171 | Average $39,788 |
| British | 53.8 /100 | #172 | Average $39,772 |
| Canadians | 51.4 /100 | #173 | Average $39,724 |
| South Americans | 50.0 /100 | #174 | Average $39,698 |
| Immigrants | South America | 47.2 /100 | #175 | Average $39,643 |
| Nigerians | 47.0 /100 | #176 | Average $39,641 |
| Costa Ricans | 46.1 /100 | #177 | Average $39,622 |
| Slavs | 45.6 /100 | #178 | Average $39,613 |
| Immigrants | Germany | 45.1 /100 | #179 | Average $39,603 |
| Immigrants | Kenya | 41.6 /100 | #180 | Average $39,535 |
| Tsimshian | 41.4 /100 | #181 | Average $39,530 |
| Tlingit-Haida | 40.5 /100 | #182 | Average $39,513 |
| Hungarians | 40.3 /100 | #183 | Average $39,510 |
| Europeans | 37.7 /100 | #184 | Fair $39,457 |
| Immigrants | West Indies | 36.9 /100 | #185 | Fair $39,441 |
| Colombians | 36.9 /100 | #186 | Fair $39,439 |
| Swedes | 36.0 /100 | #187 | Fair $39,421 |