Houma vs Immigrants from Armenia Unemployment Among Ages 35 to 44 years

COMPARE

Houma
Race
Ancestry
AfghanAfricanAlaska NativeAlaskan AthabascanAlbanianAleutAlsatianAmericanApacheArabArapahoArgentineanArmenianAssyrian/Chaldean/SyriacAustralianAustrianBahamianBangladeshiBarbadianBasqueBelgianBelizeanBermudanBhutaneseBlackfeetBolivianBrazilianBritishBritish West IndianBulgarianBurmeseCajunCambodianCanadianCape VerdeanCarpatho RusynCelticCentral AmericanCentral American IndianCherokeeCheyenneChickasawChileanChineseChippewaChoctawColombianColvilleComancheCosta RicanCreeCreekCroatianCrowCubanCypriotCzechCzechoslovakianDanishDelawareDominicanDutchDutch West IndianEastern EuropeanEcuadorianEgyptianEnglishEstonianEthiopianEuropeanFijianFilipinoFinnishFrenchFrench American IndianFrench CanadianGermanGerman RussianGhanaianGreekGuamanian/ChamorroGuatemalanGuyaneseHaitianHmongHonduranHopiHoumaHungarianIcelanderIndian (Asian)IndonesianInupiatIranianIraqiIrishIroquoisIsraeliItalianJamaicanJapaneseJordanianKenyanKiowaKoreanLaotianLatvianLebaneseLiberianLithuanianLumbeeLuxembourgerMacedonianMalaysianMalteseMarshalleseMenomineeMexicanMexican American IndianMongolianMoroccanNative HawaiianNavajoNepaleseNew ZealanderNicaraguanNigerianNorthern EuropeanNorwegianOkinawanOsageOttawaPaiutePakistaniPalestinianPanamanianParaguayanPennsylvania GermanPeruvianPimaPolishPortuguesePotawatomiPuebloPuerto RicanPuget Sound SalishRomanianRussianSalvadoranSamoanScandinavianScotch-IrishScottishSeminoleSenegaleseSerbianShoshoneSierra LeoneanSiouxSlavicSlovakSloveneSomaliSouth AfricanSouth AmericanSouth American IndianSoviet UnionSpaniardSpanishSpanish AmericanSpanish American IndianSri LankanSubsaharan AfricanSudaneseSwedishSwissSyrianTaiwaneseThaiTlingit-HaidaTohono O'OdhamTonganTrinidadian and TobagonianTsimshianTurkishU.S. Virgin IslanderUgandanUkrainianUruguayanUteVenezuelanVietnameseWelshWest IndianYakamaYaquiYugoslavianYumanYup'ikZimbabwean
Immigration
NonimmigrantsImmigrantsAfghanistanAfricaAlbaniaArgentinaAsiaAustraliaAustriaBahamasBangladeshBarbadosBelarusBelgiumBelizeBoliviaBosnia and HerzegovinaBrazilBulgariaBurma/MyanmarCabo VerdeCambodiaCameroonCanadaCaribbeanCentral AmericaChileChinaColombiaCongoCosta RicaCroatiaCubaCzechoslovakiaDenmarkDominicaDominican RepublicEastern AfricaEastern AsiaEastern EuropeEcuadorEgyptEl SalvadorEnglandEritreaEthiopiaEuropeFijiFranceGermanyGhanaGreeceGrenadaGuatemalaGuyanaHaitiHondurasHong KongHungaryIndiaIndonesiaIranIraqIrelandIsraelItalyJamaicaJapanJordanKazakhstanKenyaKoreaKuwaitLaosLatin AmericaLatviaLebanonLiberiaLithuaniaMalaysiaMexicoMicronesiaMiddle AfricaMoldovaMoroccoNepalNetherlandsNicaraguaNigeriaNorth AmericaNorth MacedoniaNorthern AfricaNorthern EuropeNorwayOceaniaPakistanPanamaPeruPhilippinesPolandPortugalRomaniaRussiaSaudi ArabiaScotlandSenegalSerbiaSierra LeoneSingaporeSomaliaSouth AfricaSouth AmericaSouth Central AsiaSouth Eastern AsiaSouthern EuropeSpainSri LankaSt. Vincent and the GrenadinesSudanSwedenSwitzerlandSyriaTaiwanThailandTrinidad and TobagoTurkeyUgandaUkraineUruguayUzbekistanVenezuelaVietnamWest IndiesWestern AfricaWestern AsiaWestern EuropeYemenZaireZimbabweAzores
Immigrants from Armenia
Race
Ancestry
AfghanAfricanAlaska NativeAlaskan AthabascanAlbanianAleutAlsatianAmericanApacheArabArapahoArgentineanArmenianAssyrian/Chaldean/SyriacAustralianAustrianBahamianBangladeshiBarbadianBasqueBelgianBelizeanBermudanBhutaneseBlackfeetBolivianBrazilianBritishBritish West IndianBulgarianBurmeseCajunCambodianCanadianCape VerdeanCarpatho RusynCelticCentral AmericanCentral American IndianCherokeeCheyenneChickasawChileanChineseChippewaChoctawColombianColvilleComancheCosta RicanCreeCreekCroatianCrowCubanCypriotCzechCzechoslovakianDanishDelawareDominicanDutchDutch West IndianEastern EuropeanEcuadorianEgyptianEnglishEstonianEthiopianEuropeanFijianFilipinoFinnishFrenchFrench American IndianFrench CanadianGermanGerman RussianGhanaianGreekGuamanian/ChamorroGuatemalanGuyaneseHaitianHmongHonduranHopiHungarianIcelanderIndian (Asian)IndonesianInupiatIranianIraqiIrishIroquoisIsraeliItalianJamaicanJapaneseJordanianKenyanKiowaKoreanLaotianLatvianLebaneseLiberianLithuanianLumbeeLuxembourgerMacedonianMalaysianMalteseMarshalleseMenomineeMexicanMexican American IndianMongolianMoroccanNative HawaiianNavajoNepaleseNew ZealanderNicaraguanNigerianNorthern EuropeanNorwegianOkinawanOsageOttawaPaiutePakistaniPalestinianPanamanianParaguayanPennsylvania GermanPeruvianPimaPolishPortuguesePotawatomiPuebloPuerto RicanPuget Sound SalishRomanianRussianSalvadoranSamoanScandinavianScotch-IrishScottishSeminoleSenegaleseSerbianShoshoneSierra LeoneanSiouxSlavicSlovakSloveneSomaliSouth AfricanSouth AmericanSouth American IndianSoviet UnionSpaniardSpanishSpanish AmericanSpanish American IndianSri LankanSubsaharan AfricanSudaneseSwedishSwissSyrianTaiwaneseThaiTlingit-HaidaTohono O'OdhamTonganTrinidadian and TobagonianTsimshianTurkishU.S. Virgin IslanderUgandanUkrainianUruguayanUteVenezuelanVietnameseWelshWest IndianYakamaYaquiYugoslavianYumanYup'ikZimbabwean
Immigration
NonimmigrantsImmigrantsAfghanistanAfricaAlbaniaArgentinaArmeniaAsiaAustraliaAustriaBahamasBangladeshBarbadosBelarusBelgiumBelizeBoliviaBosnia and HerzegovinaBrazilBulgariaBurma/MyanmarCabo VerdeCambodiaCameroonCanadaCaribbeanCentral AmericaChileChinaColombiaCongoCosta RicaCroatiaCubaCzechoslovakiaDenmarkDominicaDominican RepublicEastern AfricaEastern AsiaEastern EuropeEcuadorEgyptEl SalvadorEnglandEritreaEthiopiaEuropeFijiFranceGermanyGhanaGreeceGrenadaGuatemalaGuyanaHaitiHondurasHong KongHungaryIndiaIndonesiaIranIraqIrelandIsraelItalyJamaicaJapanJordanKazakhstanKenyaKoreaKuwaitLaosLatin AmericaLatviaLebanonLiberiaLithuaniaMalaysiaMexicoMicronesiaMiddle AfricaMoldovaMoroccoNepalNetherlandsNicaraguaNigeriaNorth AmericaNorth MacedoniaNorthern AfricaNorthern EuropeNorwayOceaniaPakistanPanamaPeruPhilippinesPolandPortugalRomaniaRussiaSaudi ArabiaScotlandSenegalSerbiaSierra LeoneSingaporeSomaliaSouth AfricaSouth AmericaSouth Central AsiaSouth Eastern AsiaSouthern EuropeSpainSri LankaSt. Vincent and the GrenadinesSudanSwedenSwitzerlandSyriaTaiwanThailandTrinidad and TobagoTurkeyUgandaUkraineUruguayUzbekistanVenezuelaVietnamWest IndiesWestern AfricaWestern AsiaWestern EuropeYemenZaireZimbabweAzores
Unemployment Among Ages 35 to 44 years
Income
Poverty
Unemployment
Labor Participation
Family Structure
Vehicle Availability
Education Level
Disability

Unemployment Among Ages 35 to 44 years Comparison

Houma

Immigrants from Armenia

Tragic
Tragic
7.8%
UNEMPLOYMENT AMONG AGES 35 TO 44 YEARS
0.0/ 100
METRIC RATING
334th/ 347
METRIC RANK
6.2%
UNEMPLOYMENT AMONG AGES 35 TO 44 YEARS
0.0/ 100
METRIC RATING
320th/ 347
METRIC RANK

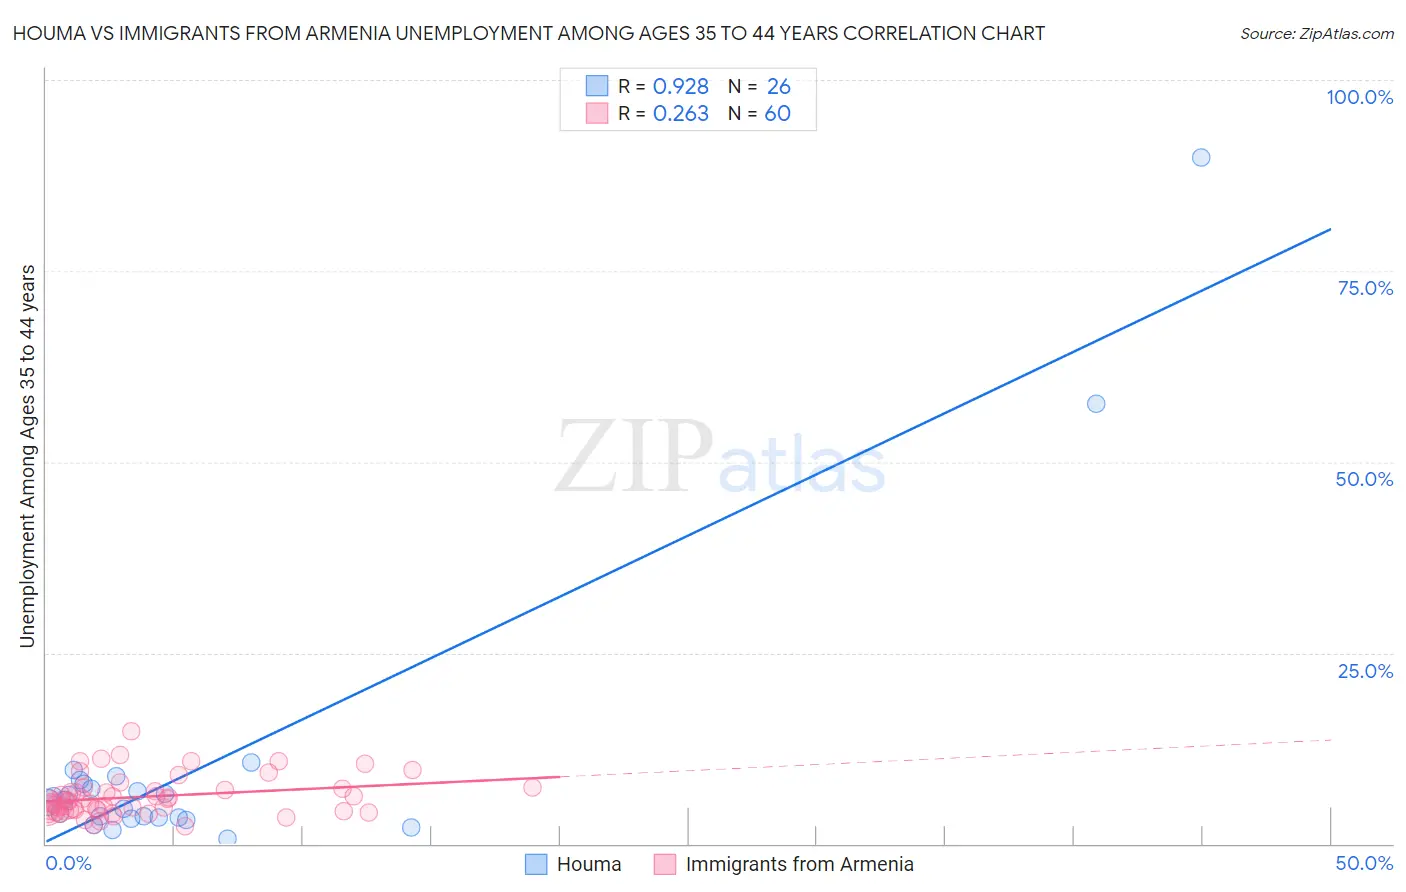
Houma vs Immigrants from Armenia Unemployment Among Ages 35 to 44 years Correlation Chart

The statistical analysis conducted on geographies consisting of 36,511,243 people shows a near-perfect positive correlation between the proportion of Houma and unemployment rate among population between the ages 35 and 44 in the United States with a correlation coefficient (R) of 0.928 and weighted average of 7.8%. Similarly, the statistical analysis conducted on geographies consisting of 97,345,029 people shows a weak positive correlation between the proportion of Immigrants from Armenia and unemployment rate among population between the ages 35 and 44 in the United States with a correlation coefficient (R) of 0.263 and weighted average of 6.2%, a difference of 25.9%.
Houma vs Immigrants from Armenia Unemployment Among Ages 35 to 44 years

Unemployment Among Ages 35 to 44 years Correlation Summary

MeasurementHoumaImmigrants from Armenia
Minimum0.70%2.3%
Maximum89.8%14.7%
Range89.1%12.4%
Mean10.5%6.2%
Median5.6%5.5%
Interquartile 25% (IQ1)3.5%4.4%
Interquartile 75% (IQ3)7.8%7.1%
Interquartile Range (IQR)4.3%2.7%
Standard Deviation (Sample)19.3%2.6%
Standard Deviation (Population)18.9%2.6%

Demographics Similar to Houma and Immigrants from Armenia by Unemployment Among Ages 35 to 44 years

In terms of unemployment among ages 35 to 44 years, the demographic groups most similar to Houma are Puerto Rican (7.6%, a difference of 2.7%), Sioux (8.4%, a difference of 6.9%), Apache (8.4%, a difference of 7.2%), Tohono O'odham (8.4%, a difference of 7.6%), and Native/Alaskan (7.3%, a difference of 8.0%). Similarly, the demographic groups most similar to Immigrants from Armenia are Chippewa (6.2%, a difference of 0.060%), Immigrants from Grenada (6.2%, a difference of 0.24%), Colville (6.2%, a difference of 0.49%), Immigrants from St. Vincent and the Grenadines (6.2%, a difference of 0.91%), and Immigrants from Dominican Republic (6.4%, a difference of 3.2%).
DemographicsRating | RankUnemployment Among Ages 35 to 44 years
Immigrants | St. Vincent and the Grenadines
0.0
/100
|
#317
Tragic
6.2%
Colville
0.0
/100
|
#318
Tragic
6.2%
Immigrants | Grenada
0.0
/100
|
#319
Tragic
6.2%
Immigrants | Armenia
0.0
/100
|
#320
Tragic
6.2%
Chippewa
0.0
/100
|
#321
Tragic
6.2%
Immigrants | Dominican Republic
0.0
/100
|
#322
Tragic
6.4%
Dominicans
0.0
/100
|
#323
Tragic
6.4%
Menominee
0.0
/100
|
#324
Tragic
6.5%
Immigrants | Yemen
0.0
/100
|
#325
Tragic
6.6%
Alaska Natives
0.0
/100
|
#326
Tragic
6.6%
Cape Verdeans
0.0
/100
|
#327
Tragic
6.6%
Shoshone
0.0
/100
|
#328
Tragic
6.6%
Paiute
0.0
/100
|
#329
Tragic
6.9%
Immigrants | Cabo Verde
0.0
/100
|
#330
Tragic
6.9%
Pueblo
0.0
/100
|
#331
Tragic
7.1%
Natives/Alaskans
0.0
/100
|
#332
Tragic
7.3%
Puerto Ricans
0.0
/100
|
#333
Tragic
7.6%
Houma
0.0
/100
|
#334
Tragic
7.8%
Sioux
0.0
/100
|
#335
Tragic
8.4%
Apache
0.0
/100
|
#336
Tragic
8.4%
Tohono O'odham
0.0
/100
|
#337
Tragic
8.4%