Colville vs Immigrants from Armenia Median Female Earnings
COMPARE
Colville
Immigrants from Armenia
Median Female Earnings
Median Female Earnings Comparison
Colville
Immigrants from Armenia
$37,514
MEDIAN FEMALE EARNINGS
1.1/ 100
METRIC RATING
255th/ 347
METRIC RANK
$40,340
MEDIAN FEMALE EARNINGS
79.2/ 100
METRIC RATING
151st/ 347
METRIC RANK
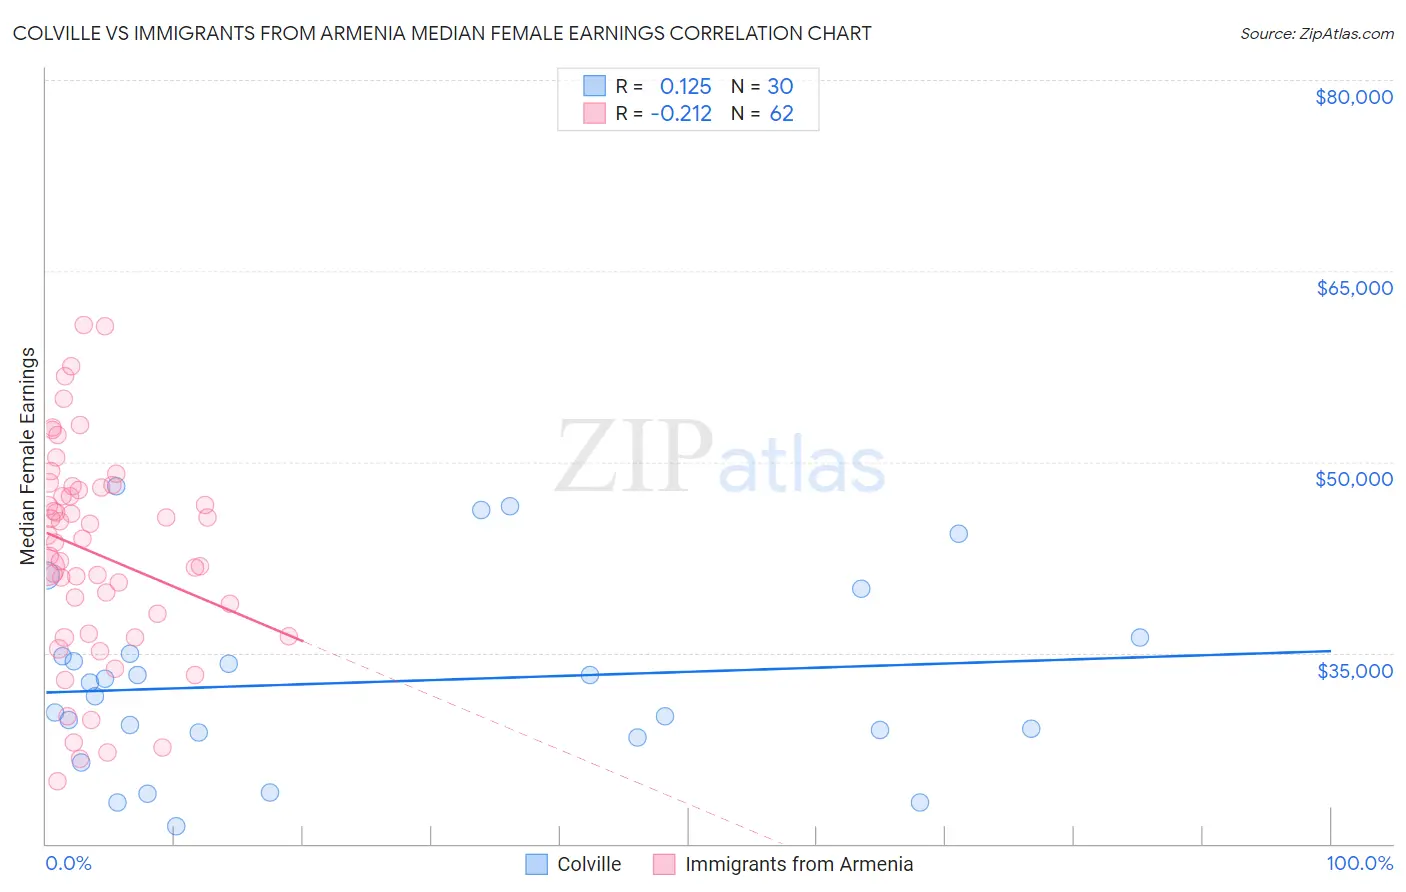
Colville vs Immigrants from Armenia Median Female Earnings Correlation Chart
The statistical analysis conducted on geographies consisting of 34,680,169 people shows a poor positive correlation between the proportion of Colville and median female earnings in the United States with a correlation coefficient (R) of 0.125 and weighted average of $37,514. Similarly, the statistical analysis conducted on geographies consisting of 97,714,677 people shows a weak negative correlation between the proportion of Immigrants from Armenia and median female earnings in the United States with a correlation coefficient (R) of -0.212 and weighted average of $40,340, a difference of 7.5%.
Median Female Earnings Correlation Summary
| Measurement | Colville | Immigrants from Armenia |
| Minimum | $21,333 | $24,884 |
| Maximum | $48,065 | $60,766 |
| Range | $26,732 | $35,882 |
| Mean | $32,694 | $42,818 |
| Median | $32,120 | $43,807 |
| Interquartile 25% (IQ1) | $28,750 | $36,510 |
| Interquartile 75% (IQ3) | $34,898 | $47,965 |
| Interquartile Range (IQR) | $6,148 | $11,455 |
| Standard Deviation (Sample) | $7,179 | $8,342 |
| Standard Deviation (Population) | $7,058 | $8,274 |
Similar Demographics by Median Female Earnings
Demographics Similar to Colville by Median Female Earnings
In terms of median female earnings, the demographic groups most similar to Colville are White/Caucasian ($37,531, a difference of 0.040%), Samoan ($37,498, a difference of 0.040%), Hawaiian ($37,497, a difference of 0.040%), Belizean ($37,429, a difference of 0.23%), and Scotch-Irish ($37,383, a difference of 0.35%).
| Demographics | Rating | Rank | Median Female Earnings |
| Alaskan Athabascans | 2.3 /100 | #248 | Tragic $37,905 |
| Swiss | 2.3 /100 | #249 | Tragic $37,904 |
| Immigrants | Iraq | 2.2 /100 | #250 | Tragic $37,864 |
| Welsh | 2.1 /100 | #251 | Tragic $37,856 |
| Immigrants | Dominica | 2.0 /100 | #252 | Tragic $37,825 |
| Danes | 1.6 /100 | #253 | Tragic $37,730 |
| Whites/Caucasians | 1.1 /100 | #254 | Tragic $37,531 |
| Colville | 1.1 /100 | #255 | Tragic $37,514 |
| Samoans | 1.0 /100 | #256 | Tragic $37,498 |
| Hawaiians | 1.0 /100 | #257 | Tragic $37,497 |
| Belizeans | 0.9 /100 | #258 | Tragic $37,429 |
| Scotch-Irish | 0.8 /100 | #259 | Tragic $37,383 |
| Dutch | 0.7 /100 | #260 | Tragic $37,339 |
| Malaysians | 0.7 /100 | #261 | Tragic $37,298 |
| Venezuelans | 0.7 /100 | #262 | Tragic $37,282 |
Demographics Similar to Immigrants from Armenia by Median Female Earnings
In terms of median female earnings, the demographic groups most similar to Immigrants from Armenia are Immigrants from Cameroon ($40,354, a difference of 0.030%), Immigrants from Chile ($40,353, a difference of 0.030%), West Indian ($40,317, a difference of 0.060%), Polish ($40,371, a difference of 0.080%), and Vietnamese ($40,377, a difference of 0.090%).
| Demographics | Rating | Rank | Median Female Earnings |
| Immigrants | North Macedonia | 83.8 /100 | #144 | Excellent $40,488 |
| Brazilians | 83.6 /100 | #145 | Excellent $40,483 |
| Ghanaians | 82.1 /100 | #146 | Excellent $40,429 |
| Vietnamese | 80.4 /100 | #147 | Excellent $40,377 |
| Poles | 80.2 /100 | #148 | Excellent $40,371 |
| Immigrants | Cameroon | 79.7 /100 | #149 | Good $40,354 |
| Immigrants | Chile | 79.6 /100 | #150 | Good $40,353 |
| Immigrants | Armenia | 79.2 /100 | #151 | Good $40,340 |
| West Indians | 78.4 /100 | #152 | Good $40,317 |
| British West Indians | 77.7 /100 | #153 | Good $40,299 |
| Immigrants | Oceania | 77.6 /100 | #154 | Good $40,297 |
| Immigrants | Africa | 76.2 /100 | #155 | Good $40,257 |
| Peruvians | 75.3 /100 | #156 | Good $40,234 |
| Portuguese | 73.0 /100 | #157 | Good $40,177 |
| Immigrants | Senegal | 72.2 /100 | #158 | Good $40,157 |