Brazilian vs Immigrants from Armenia Median Female Earnings
COMPARE
Brazilian
Immigrants from Armenia
Median Female Earnings
Median Female Earnings Comparison
Brazilians
Immigrants from Armenia
$40,483
MEDIAN FEMALE EARNINGS
83.6/ 100
METRIC RATING
145th/ 347
METRIC RANK
$40,340
MEDIAN FEMALE EARNINGS
79.2/ 100
METRIC RATING
151st/ 347
METRIC RANK
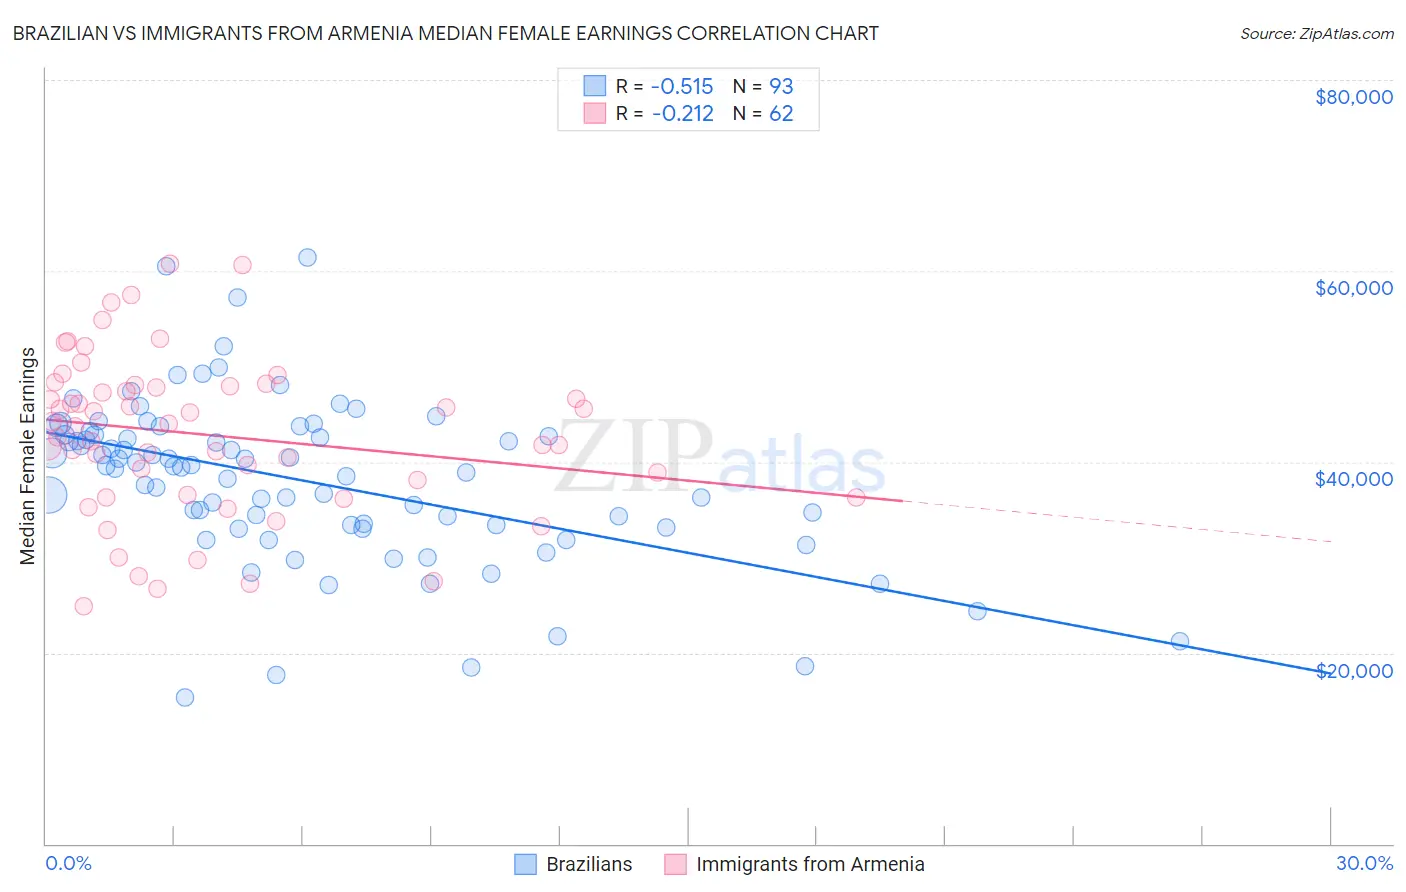
Brazilian vs Immigrants from Armenia Median Female Earnings Correlation Chart
The statistical analysis conducted on geographies consisting of 323,890,405 people shows a substantial negative correlation between the proportion of Brazilians and median female earnings in the United States with a correlation coefficient (R) of -0.515 and weighted average of $40,483. Similarly, the statistical analysis conducted on geographies consisting of 97,714,677 people shows a weak negative correlation between the proportion of Immigrants from Armenia and median female earnings in the United States with a correlation coefficient (R) of -0.212 and weighted average of $40,340, a difference of 0.35%.
Median Female Earnings Correlation Summary
| Measurement | Brazilian | Immigrants from Armenia |
| Minimum | $15,384 | $24,884 |
| Maximum | $61,398 | $60,766 |
| Range | $46,014 | $35,882 |
| Mean | $38,053 | $42,818 |
| Median | $39,528 | $43,807 |
| Interquartile 25% (IQ1) | $33,268 | $36,510 |
| Interquartile 75% (IQ3) | $42,843 | $47,965 |
| Interquartile Range (IQR) | $9,575 | $11,455 |
| Standard Deviation (Sample) | $8,528 | $8,342 |
| Standard Deviation (Population) | $8,482 | $8,274 |
Demographics Similar to Brazilians and Immigrants from Armenia by Median Female Earnings
In terms of median female earnings, the demographic groups most similar to Brazilians are Immigrants from North Macedonia ($40,488, a difference of 0.010%), Northern European ($40,491, a difference of 0.020%), Sri Lankan ($40,496, a difference of 0.030%), Immigrants from Syria ($40,499, a difference of 0.040%), and Ghanaian ($40,429, a difference of 0.13%). Similarly, the demographic groups most similar to Immigrants from Armenia are Immigrants from Cameroon ($40,354, a difference of 0.030%), Immigrants from Chile ($40,353, a difference of 0.030%), West Indian ($40,317, a difference of 0.060%), Polish ($40,371, a difference of 0.080%), and Vietnamese ($40,377, a difference of 0.090%).
| Demographics | Rating | Rank | Median Female Earnings |
| Taiwanese | 86.1 /100 | #138 | Excellent $40,576 |
| Immigrants | South Eastern Asia | 85.7 /100 | #139 | Excellent $40,558 |
| Serbians | 85.2 /100 | #140 | Excellent $40,539 |
| Immigrants | Syria | 84.1 /100 | #141 | Excellent $40,499 |
| Sri Lankans | 84.0 /100 | #142 | Excellent $40,496 |
| Northern Europeans | 83.9 /100 | #143 | Excellent $40,491 |
| Immigrants | North Macedonia | 83.8 /100 | #144 | Excellent $40,488 |
| Brazilians | 83.6 /100 | #145 | Excellent $40,483 |
| Ghanaians | 82.1 /100 | #146 | Excellent $40,429 |
| Vietnamese | 80.4 /100 | #147 | Excellent $40,377 |
| Poles | 80.2 /100 | #148 | Excellent $40,371 |
| Immigrants | Cameroon | 79.7 /100 | #149 | Good $40,354 |
| Immigrants | Chile | 79.6 /100 | #150 | Good $40,353 |
| Immigrants | Armenia | 79.2 /100 | #151 | Good $40,340 |
| West Indians | 78.4 /100 | #152 | Good $40,317 |
| British West Indians | 77.7 /100 | #153 | Good $40,299 |
| Immigrants | Oceania | 77.6 /100 | #154 | Good $40,297 |
| Immigrants | Africa | 76.2 /100 | #155 | Good $40,257 |
| Peruvians | 75.3 /100 | #156 | Good $40,234 |
| Portuguese | 73.0 /100 | #157 | Good $40,177 |
| Immigrants | Senegal | 72.2 /100 | #158 | Good $40,157 |