Houma vs Hawaiian Per Capita Income
COMPARE
Houma
Hawaiian
Per Capita Income
Per Capita Income Comparison
Houma
Hawaiians
$32,996
PER CAPITA INCOME
0.0/ 100
METRIC RATING
337th/ 347
METRIC RANK
$39,403
PER CAPITA INCOME
0.8/ 100
METRIC RATING
256th/ 347
METRIC RANK
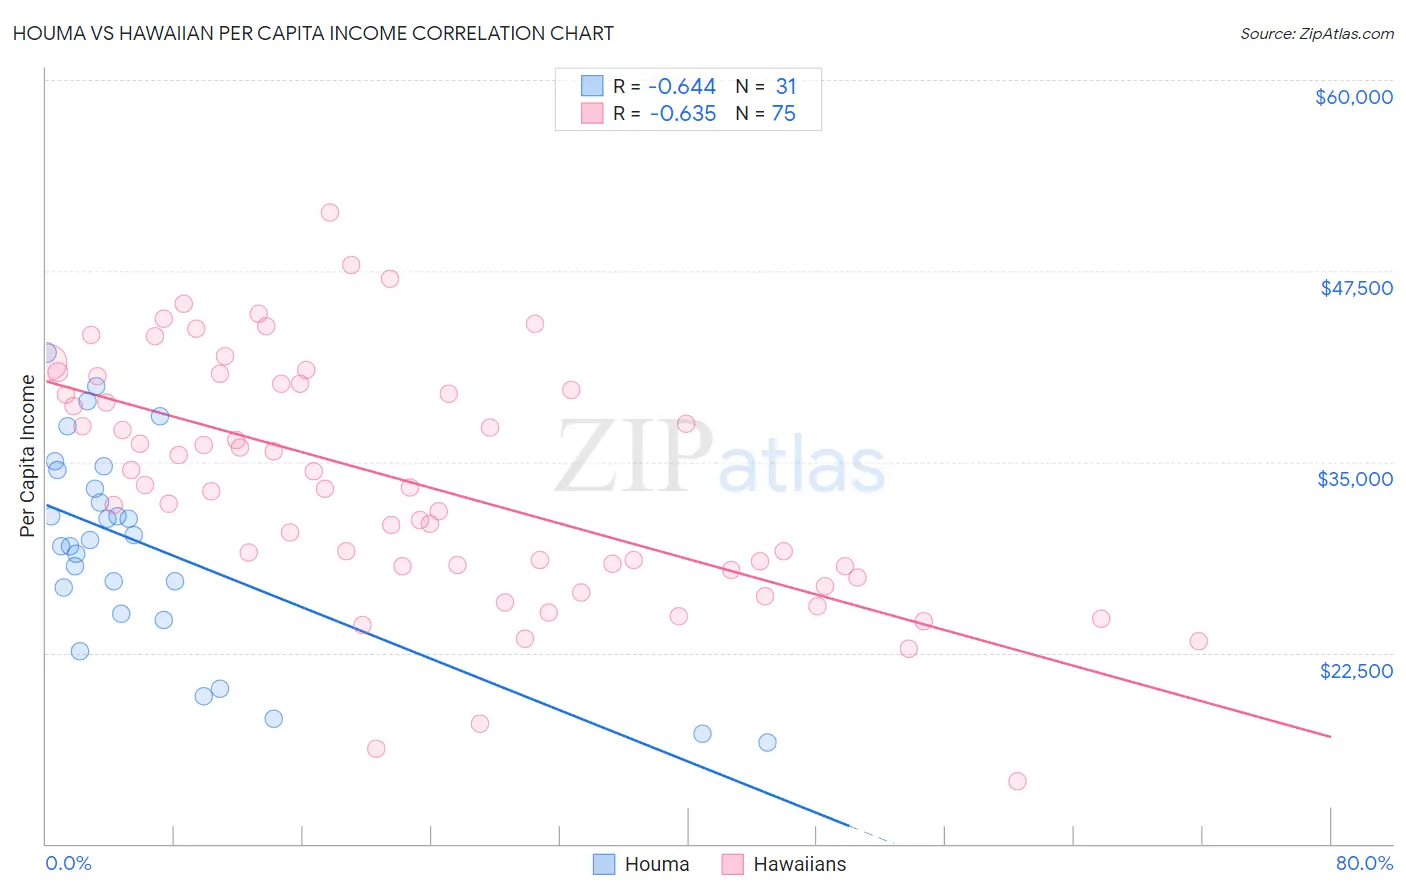
Houma vs Hawaiian Per Capita Income Correlation Chart
The statistical analysis conducted on geographies consisting of 36,799,095 people shows a significant negative correlation between the proportion of Houma and per capita income in the United States with a correlation coefficient (R) of -0.644 and weighted average of $32,996. Similarly, the statistical analysis conducted on geographies consisting of 327,629,067 people shows a significant negative correlation between the proportion of Hawaiians and per capita income in the United States with a correlation coefficient (R) of -0.635 and weighted average of $39,403, a difference of 19.4%.
Per Capita Income Correlation Summary
| Measurement | Houma | Hawaiian |
| Minimum | $16,626 | $14,082 |
| Maximum | $42,187 | $51,335 |
| Range | $25,561 | $37,253 |
| Mean | $29,455 | $33,620 |
| Median | $29,877 | $33,340 |
| Interquartile 25% (IQ1) | $25,090 | $28,161 |
| Interquartile 75% (IQ3) | $34,460 | $40,110 |
| Interquartile Range (IQR) | $9,370 | $11,949 |
| Standard Deviation (Sample) | $6,714 | $7,838 |
| Standard Deviation (Population) | $6,604 | $7,785 |
Similar Demographics by Per Capita Income
Demographics Similar to Houma by Per Capita Income
In terms of per capita income, the demographic groups most similar to Houma are Yakama ($33,009, a difference of 0.040%), Yuman ($33,236, a difference of 0.73%), Native/Alaskan ($33,279, a difference of 0.86%), Arapaho ($32,345, a difference of 2.0%), and Immigrants from Yemen ($33,696, a difference of 2.1%).
| Demographics | Rating | Rank | Per Capita Income |
| Spanish American Indians | 0.0 /100 | #330 | Tragic $34,195 |
| Immigrants | Mexico | 0.0 /100 | #331 | Tragic $33,931 |
| Sioux | 0.0 /100 | #332 | Tragic $33,921 |
| Immigrants | Yemen | 0.0 /100 | #333 | Tragic $33,696 |
| Natives/Alaskans | 0.0 /100 | #334 | Tragic $33,279 |
| Yuman | 0.0 /100 | #335 | Tragic $33,236 |
| Yakama | 0.0 /100 | #336 | Tragic $33,009 |
| Houma | 0.0 /100 | #337 | Tragic $32,996 |
| Arapaho | 0.0 /100 | #338 | Tragic $32,345 |
| Pueblo | 0.0 /100 | #339 | Tragic $32,012 |
| Crow | 0.0 /100 | #340 | Tragic $31,729 |
| Puerto Ricans | 0.0 /100 | #341 | Tragic $31,268 |
| Hopi | 0.0 /100 | #342 | Tragic $31,177 |
| Pima | 0.0 /100 | #343 | Tragic $30,644 |
| Yup'ik | 0.0 /100 | #344 | Tragic $30,518 |
Demographics Similar to Hawaiians by Per Capita Income
In terms of per capita income, the demographic groups most similar to Hawaiians are Nicaraguan ($39,372, a difference of 0.080%), Immigrants from Middle Africa ($39,529, a difference of 0.32%), Alaska Native ($39,558, a difference of 0.39%), Osage ($39,568, a difference of 0.42%), and Jamaican ($39,231, a difference of 0.44%).
| Demographics | Rating | Rank | Per Capita Income |
| Japanese | 1.4 /100 | #249 | Tragic $39,870 |
| Immigrants | Burma/Myanmar | 1.3 /100 | #250 | Tragic $39,827 |
| Samoans | 1.3 /100 | #251 | Tragic $39,826 |
| Immigrants | Azores | 1.0 /100 | #252 | Tragic $39,608 |
| Osage | 1.0 /100 | #253 | Tragic $39,568 |
| Alaska Natives | 1.0 /100 | #254 | Tragic $39,558 |
| Immigrants | Middle Africa | 1.0 /100 | #255 | Tragic $39,529 |
| Hawaiians | 0.8 /100 | #256 | Tragic $39,403 |
| Nicaraguans | 0.8 /100 | #257 | Tragic $39,372 |
| Jamaicans | 0.7 /100 | #258 | Tragic $39,231 |
| Malaysians | 0.7 /100 | #259 | Tragic $39,194 |
| Alaskan Athabascans | 0.6 /100 | #260 | Tragic $39,163 |
| Marshallese | 0.6 /100 | #261 | Tragic $39,108 |
| Iroquois | 0.6 /100 | #262 | Tragic $39,104 |
| Belizeans | 0.6 /100 | #263 | Tragic $39,097 |