Houma vs Immigrants from Jordan Per Capita Income
COMPARE
Houma
Immigrants from Jordan
Per Capita Income
Per Capita Income Comparison
Houma
Immigrants from Jordan
$32,996
PER CAPITA INCOME
0.0/ 100
METRIC RATING
337th/ 347
METRIC RANK
$45,066
PER CAPITA INCOME
82.9/ 100
METRIC RATING
140th/ 347
METRIC RANK
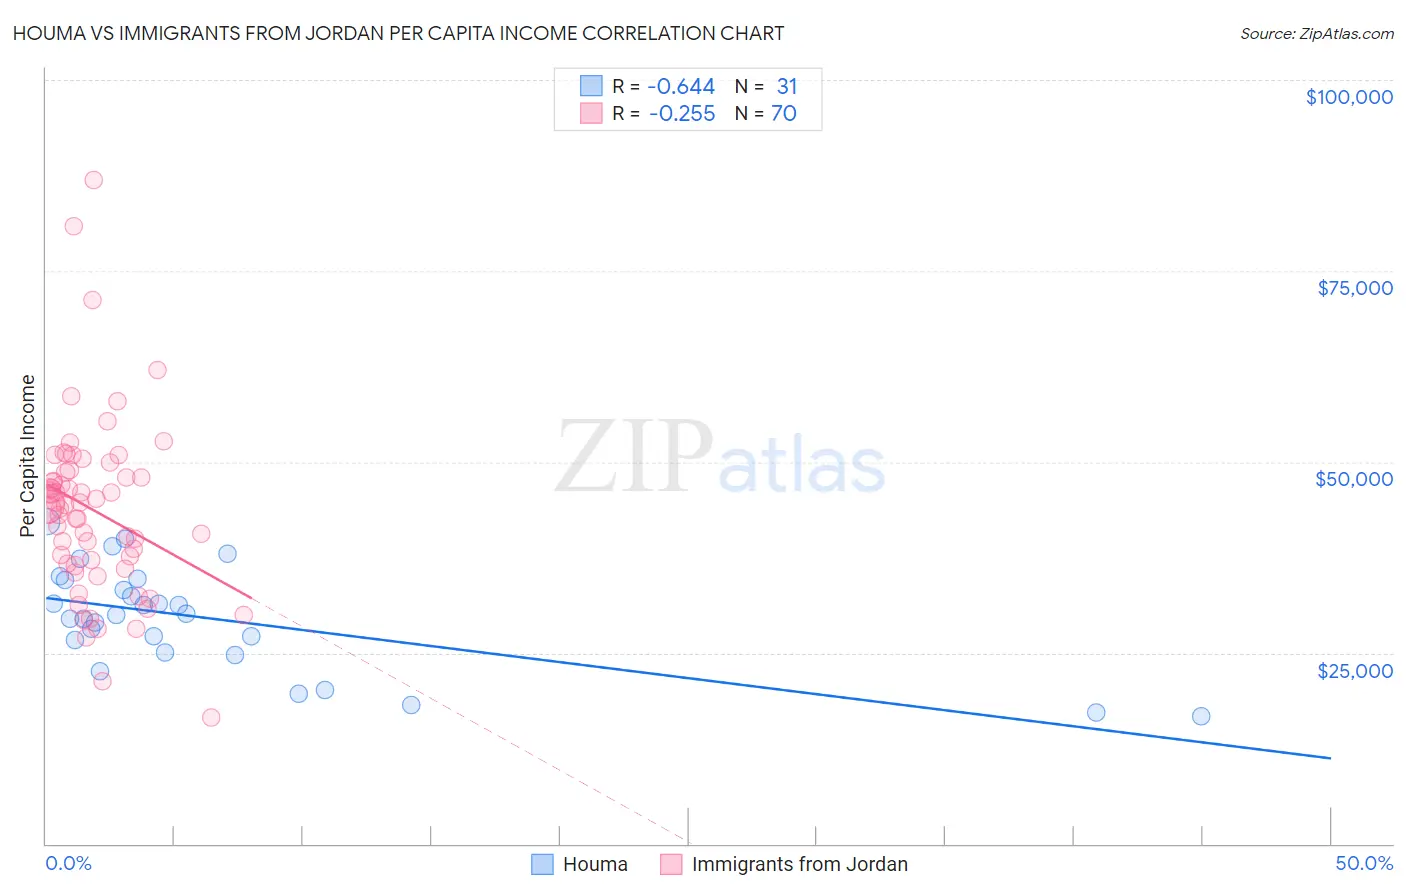
Houma vs Immigrants from Jordan Per Capita Income Correlation Chart
The statistical analysis conducted on geographies consisting of 36,799,095 people shows a significant negative correlation between the proportion of Houma and per capita income in the United States with a correlation coefficient (R) of -0.644 and weighted average of $32,996. Similarly, the statistical analysis conducted on geographies consisting of 181,275,408 people shows a weak negative correlation between the proportion of Immigrants from Jordan and per capita income in the United States with a correlation coefficient (R) of -0.255 and weighted average of $45,066, a difference of 36.6%.
Per Capita Income Correlation Summary
| Measurement | Houma | Immigrants from Jordan |
| Minimum | $16,626 | $16,508 |
| Maximum | $42,187 | $86,887 |
| Range | $25,561 | $70,379 |
| Mean | $29,455 | $43,703 |
| Median | $29,877 | $44,361 |
| Interquartile 25% (IQ1) | $25,090 | $36,695 |
| Interquartile 75% (IQ3) | $34,460 | $48,682 |
| Interquartile Range (IQR) | $9,370 | $11,987 |
| Standard Deviation (Sample) | $6,714 | $11,687 |
| Standard Deviation (Population) | $6,604 | $11,603 |
Similar Demographics by Per Capita Income
Demographics Similar to Houma by Per Capita Income
In terms of per capita income, the demographic groups most similar to Houma are Yakama ($33,009, a difference of 0.040%), Yuman ($33,236, a difference of 0.73%), Native/Alaskan ($33,279, a difference of 0.86%), Arapaho ($32,345, a difference of 2.0%), and Immigrants from Yemen ($33,696, a difference of 2.1%).
| Demographics | Rating | Rank | Per Capita Income |
| Spanish American Indians | 0.0 /100 | #330 | Tragic $34,195 |
| Immigrants | Mexico | 0.0 /100 | #331 | Tragic $33,931 |
| Sioux | 0.0 /100 | #332 | Tragic $33,921 |
| Immigrants | Yemen | 0.0 /100 | #333 | Tragic $33,696 |
| Natives/Alaskans | 0.0 /100 | #334 | Tragic $33,279 |
| Yuman | 0.0 /100 | #335 | Tragic $33,236 |
| Yakama | 0.0 /100 | #336 | Tragic $33,009 |
| Houma | 0.0 /100 | #337 | Tragic $32,996 |
| Arapaho | 0.0 /100 | #338 | Tragic $32,345 |
| Pueblo | 0.0 /100 | #339 | Tragic $32,012 |
| Crow | 0.0 /100 | #340 | Tragic $31,729 |
| Puerto Ricans | 0.0 /100 | #341 | Tragic $31,268 |
| Hopi | 0.0 /100 | #342 | Tragic $31,177 |
| Pima | 0.0 /100 | #343 | Tragic $30,644 |
| Yup'ik | 0.0 /100 | #344 | Tragic $30,518 |
Demographics Similar to Immigrants from Jordan by Per Capita Income
In terms of per capita income, the demographic groups most similar to Immigrants from Jordan are Slavic ($45,049, a difference of 0.040%), Ugandan ($45,047, a difference of 0.040%), Basque ($45,086, a difference of 0.050%), Immigrants from Uganda ($45,043, a difference of 0.050%), and Icelander ($44,987, a difference of 0.18%).
| Demographics | Rating | Rank | Per Capita Income |
| Pakistanis | 89.7 /100 | #133 | Excellent $45,587 |
| Slovenes | 89.6 /100 | #134 | Excellent $45,581 |
| Hungarians | 87.9 /100 | #135 | Excellent $45,426 |
| Immigrants | Oceania | 85.2 /100 | #136 | Excellent $45,220 |
| Immigrants | Syria | 85.2 /100 | #137 | Excellent $45,218 |
| Assyrians/Chaldeans/Syriacs | 84.8 /100 | #138 | Excellent $45,195 |
| Basques | 83.2 /100 | #139 | Excellent $45,086 |
| Immigrants | Jordan | 82.9 /100 | #140 | Excellent $45,066 |
| Slavs | 82.6 /100 | #141 | Excellent $45,049 |
| Ugandans | 82.6 /100 | #142 | Excellent $45,047 |
| Immigrants | Uganda | 82.5 /100 | #143 | Excellent $45,043 |
| Icelanders | 81.6 /100 | #144 | Excellent $44,987 |
| Immigrants | Afghanistan | 78.0 /100 | #145 | Good $44,790 |
| Irish | 75.8 /100 | #146 | Good $44,679 |
| Czechs | 74.1 /100 | #147 | Good $44,595 |