Immigrants from Liberia vs Hawaiian Per Capita Income
COMPARE
Immigrants from Liberia
Hawaiian
Per Capita Income
Per Capita Income Comparison
Immigrants from Liberia
Hawaiians
$38,165
PER CAPITA INCOME
0.2/ 100
METRIC RATING
275th/ 347
METRIC RANK
$39,403
PER CAPITA INCOME
0.8/ 100
METRIC RATING
256th/ 347
METRIC RANK
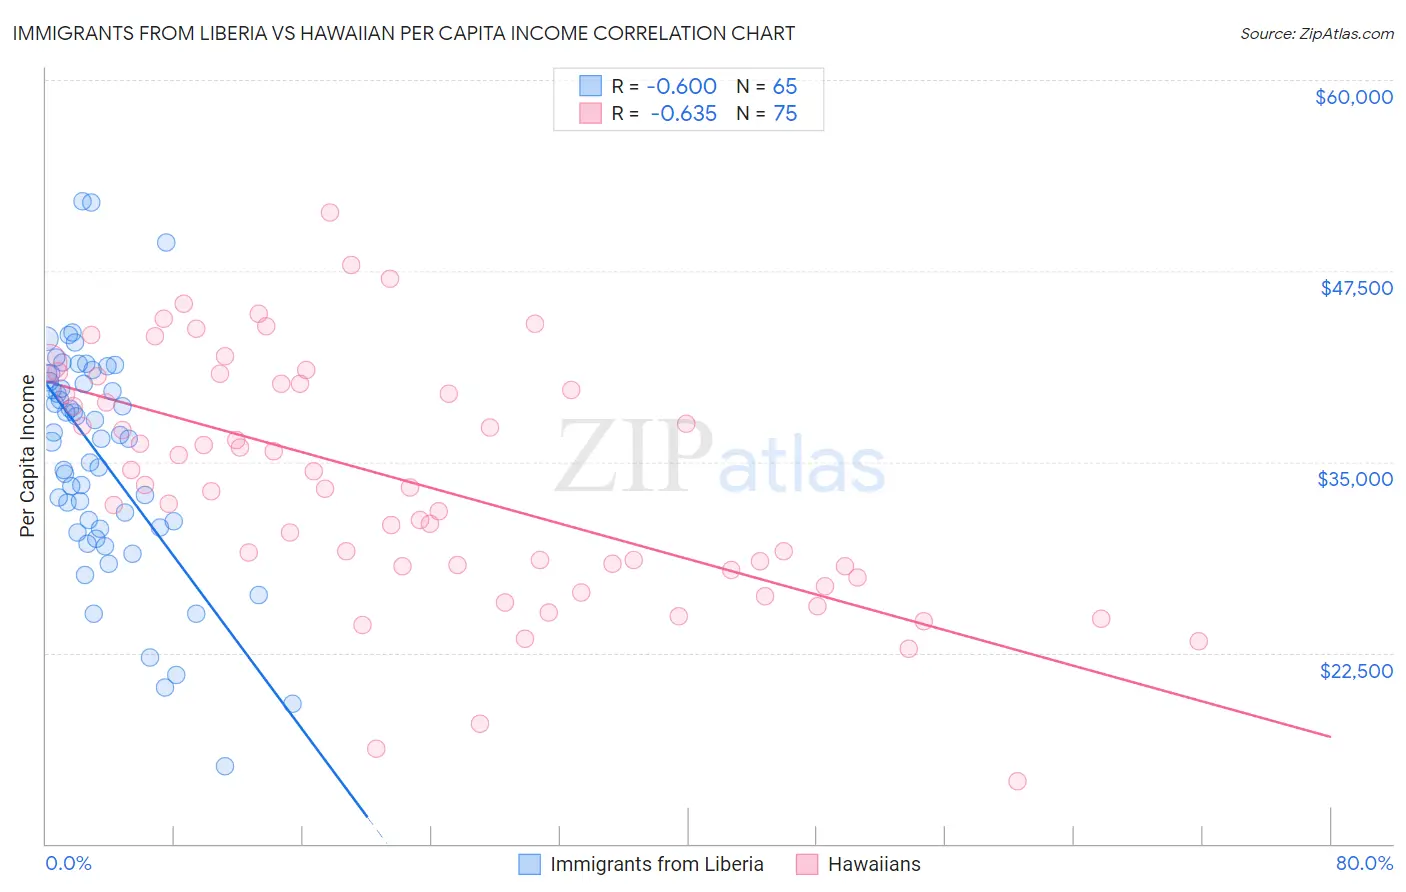
Immigrants from Liberia vs Hawaiian Per Capita Income Correlation Chart
The statistical analysis conducted on geographies consisting of 135,297,410 people shows a substantial negative correlation between the proportion of Immigrants from Liberia and per capita income in the United States with a correlation coefficient (R) of -0.600 and weighted average of $38,165. Similarly, the statistical analysis conducted on geographies consisting of 327,629,067 people shows a significant negative correlation between the proportion of Hawaiians and per capita income in the United States with a correlation coefficient (R) of -0.635 and weighted average of $39,403, a difference of 3.2%.
Per Capita Income Correlation Summary
| Measurement | Immigrants from Liberia | Hawaiian |
| Minimum | $15,041 | $14,082 |
| Maximum | $52,065 | $51,335 |
| Range | $37,024 | $37,253 |
| Mean | $35,319 | $33,620 |
| Median | $36,534 | $33,340 |
| Interquartile 25% (IQ1) | $30,654 | $28,161 |
| Interquartile 75% (IQ3) | $40,514 | $40,110 |
| Interquartile Range (IQR) | $9,860 | $11,949 |
| Standard Deviation (Sample) | $7,386 | $7,838 |
| Standard Deviation (Population) | $7,329 | $7,785 |
Demographics Similar to Immigrants from Liberia and Hawaiians by Per Capita Income
In terms of per capita income, the demographic groups most similar to Immigrants from Liberia are Immigrants from El Salvador ($38,394, a difference of 0.60%), Nepalese ($38,442, a difference of 0.73%), Immigrants from Cabo Verde ($38,540, a difference of 0.98%), Central American ($38,560, a difference of 1.0%), and Immigrants from Belize ($38,614, a difference of 1.2%). Similarly, the demographic groups most similar to Hawaiians are Nicaraguan ($39,372, a difference of 0.080%), Immigrants from Middle Africa ($39,529, a difference of 0.32%), Jamaican ($39,231, a difference of 0.44%), Malaysian ($39,194, a difference of 0.53%), and Alaskan Athabascan ($39,163, a difference of 0.61%).
| Demographics | Rating | Rank | Per Capita Income |
| Immigrants | Middle Africa | 1.0 /100 | #255 | Tragic $39,529 |
| Hawaiians | 0.8 /100 | #256 | Tragic $39,403 |
| Nicaraguans | 0.8 /100 | #257 | Tragic $39,372 |
| Jamaicans | 0.7 /100 | #258 | Tragic $39,231 |
| Malaysians | 0.7 /100 | #259 | Tragic $39,194 |
| Alaskan Athabascans | 0.6 /100 | #260 | Tragic $39,163 |
| Marshallese | 0.6 /100 | #261 | Tragic $39,108 |
| Iroquois | 0.6 /100 | #262 | Tragic $39,104 |
| Belizeans | 0.6 /100 | #263 | Tragic $39,097 |
| Americans | 0.6 /100 | #264 | Tragic $39,039 |
| Spanish Americans | 0.5 /100 | #265 | Tragic $39,012 |
| Salvadorans | 0.5 /100 | #266 | Tragic $38,858 |
| Immigrants | Zaire | 0.4 /100 | #267 | Tragic $38,848 |
| Liberians | 0.4 /100 | #268 | Tragic $38,780 |
| Immigrants | Jamaica | 0.4 /100 | #269 | Tragic $38,766 |
| Immigrants | Belize | 0.3 /100 | #270 | Tragic $38,614 |
| Central Americans | 0.3 /100 | #271 | Tragic $38,560 |
| Immigrants | Cabo Verde | 0.3 /100 | #272 | Tragic $38,540 |
| Nepalese | 0.3 /100 | #273 | Tragic $38,442 |
| Immigrants | El Salvador | 0.3 /100 | #274 | Tragic $38,394 |
| Immigrants | Liberia | 0.2 /100 | #275 | Tragic $38,165 |