Houma vs Bhutanese Per Capita Income
COMPARE
Houma
Bhutanese
Per Capita Income
Per Capita Income Comparison
Houma
Bhutanese
$32,996
PER CAPITA INCOME
0.0/ 100
METRIC RATING
337th/ 347
METRIC RANK
$49,894
PER CAPITA INCOME
99.9/ 100
METRIC RATING
59th/ 347
METRIC RANK
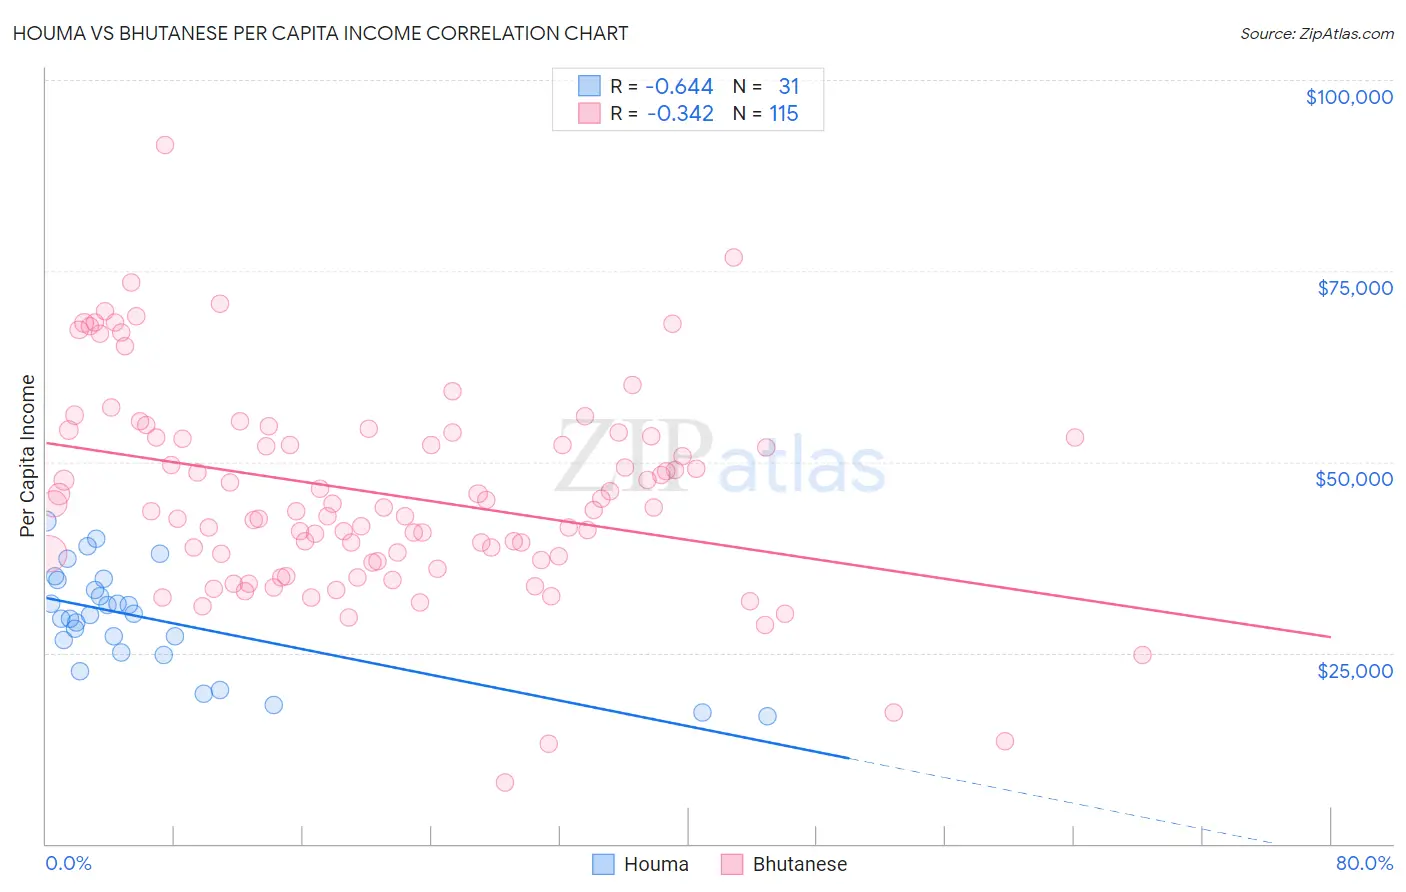
Houma vs Bhutanese Per Capita Income Correlation Chart
The statistical analysis conducted on geographies consisting of 36,799,095 people shows a significant negative correlation between the proportion of Houma and per capita income in the United States with a correlation coefficient (R) of -0.644 and weighted average of $32,996. Similarly, the statistical analysis conducted on geographies consisting of 455,599,247 people shows a mild negative correlation between the proportion of Bhutanese and per capita income in the United States with a correlation coefficient (R) of -0.342 and weighted average of $49,894, a difference of 51.2%.
Per Capita Income Correlation Summary
| Measurement | Houma | Bhutanese |
| Minimum | $16,626 | $8,097 |
| Maximum | $42,187 | $91,569 |
| Range | $25,561 | $83,472 |
| Mean | $29,455 | $45,753 |
| Median | $29,877 | $44,077 |
| Interquartile 25% (IQ1) | $25,090 | $37,217 |
| Interquartile 75% (IQ3) | $34,460 | $53,334 |
| Interquartile Range (IQR) | $9,370 | $16,117 |
| Standard Deviation (Sample) | $6,714 | $13,593 |
| Standard Deviation (Population) | $6,604 | $13,533 |
Similar Demographics by Per Capita Income
Demographics Similar to Houma by Per Capita Income
In terms of per capita income, the demographic groups most similar to Houma are Yakama ($33,009, a difference of 0.040%), Yuman ($33,236, a difference of 0.73%), Native/Alaskan ($33,279, a difference of 0.86%), Arapaho ($32,345, a difference of 2.0%), and Immigrants from Yemen ($33,696, a difference of 2.1%).
| Demographics | Rating | Rank | Per Capita Income |
| Spanish American Indians | 0.0 /100 | #330 | Tragic $34,195 |
| Immigrants | Mexico | 0.0 /100 | #331 | Tragic $33,931 |
| Sioux | 0.0 /100 | #332 | Tragic $33,921 |
| Immigrants | Yemen | 0.0 /100 | #333 | Tragic $33,696 |
| Natives/Alaskans | 0.0 /100 | #334 | Tragic $33,279 |
| Yuman | 0.0 /100 | #335 | Tragic $33,236 |
| Yakama | 0.0 /100 | #336 | Tragic $33,009 |
| Houma | 0.0 /100 | #337 | Tragic $32,996 |
| Arapaho | 0.0 /100 | #338 | Tragic $32,345 |
| Pueblo | 0.0 /100 | #339 | Tragic $32,012 |
| Crow | 0.0 /100 | #340 | Tragic $31,729 |
| Puerto Ricans | 0.0 /100 | #341 | Tragic $31,268 |
| Hopi | 0.0 /100 | #342 | Tragic $31,177 |
| Pima | 0.0 /100 | #343 | Tragic $30,644 |
| Yup'ik | 0.0 /100 | #344 | Tragic $30,518 |
Demographics Similar to Bhutanese by Per Capita Income
In terms of per capita income, the demographic groups most similar to Bhutanese are Immigrants from Scotland ($49,893, a difference of 0.0%), Argentinean ($49,862, a difference of 0.070%), Immigrants from Malaysia ($49,983, a difference of 0.18%), South African ($50,044, a difference of 0.30%), and Immigrants from Asia ($49,741, a difference of 0.31%).
| Demographics | Rating | Rank | Per Capita Income |
| Immigrants | Croatia | 99.9 /100 | #52 | Exceptional $50,417 |
| Paraguayans | 99.9 /100 | #53 | Exceptional $50,385 |
| Immigrants | Belarus | 99.9 /100 | #54 | Exceptional $50,303 |
| Immigrants | Western Europe | 99.9 /100 | #55 | Exceptional $50,065 |
| Asians | 99.9 /100 | #56 | Exceptional $50,057 |
| South Africans | 99.9 /100 | #57 | Exceptional $50,044 |
| Immigrants | Malaysia | 99.9 /100 | #58 | Exceptional $49,983 |
| Bhutanese | 99.9 /100 | #59 | Exceptional $49,894 |
| Immigrants | Scotland | 99.9 /100 | #60 | Exceptional $49,893 |
| Argentineans | 99.9 /100 | #61 | Exceptional $49,862 |
| Immigrants | Asia | 99.9 /100 | #62 | Exceptional $49,741 |
| Maltese | 99.9 /100 | #63 | Exceptional $49,640 |
| Immigrants | Argentina | 99.9 /100 | #64 | Exceptional $49,627 |
| Bolivians | 99.9 /100 | #65 | Exceptional $49,526 |
| Immigrants | Bulgaria | 99.9 /100 | #66 | Exceptional $49,482 |