Houma vs Sierra Leonean Per Capita Income
COMPARE
Houma
Sierra Leonean
Per Capita Income
Per Capita Income Comparison
Houma
Sierra Leoneans
$32,996
PER CAPITA INCOME
0.0/ 100
METRIC RATING
337th/ 347
METRIC RANK
$43,405
PER CAPITA INCOME
42.9/ 100
METRIC RATING
180th/ 347
METRIC RANK
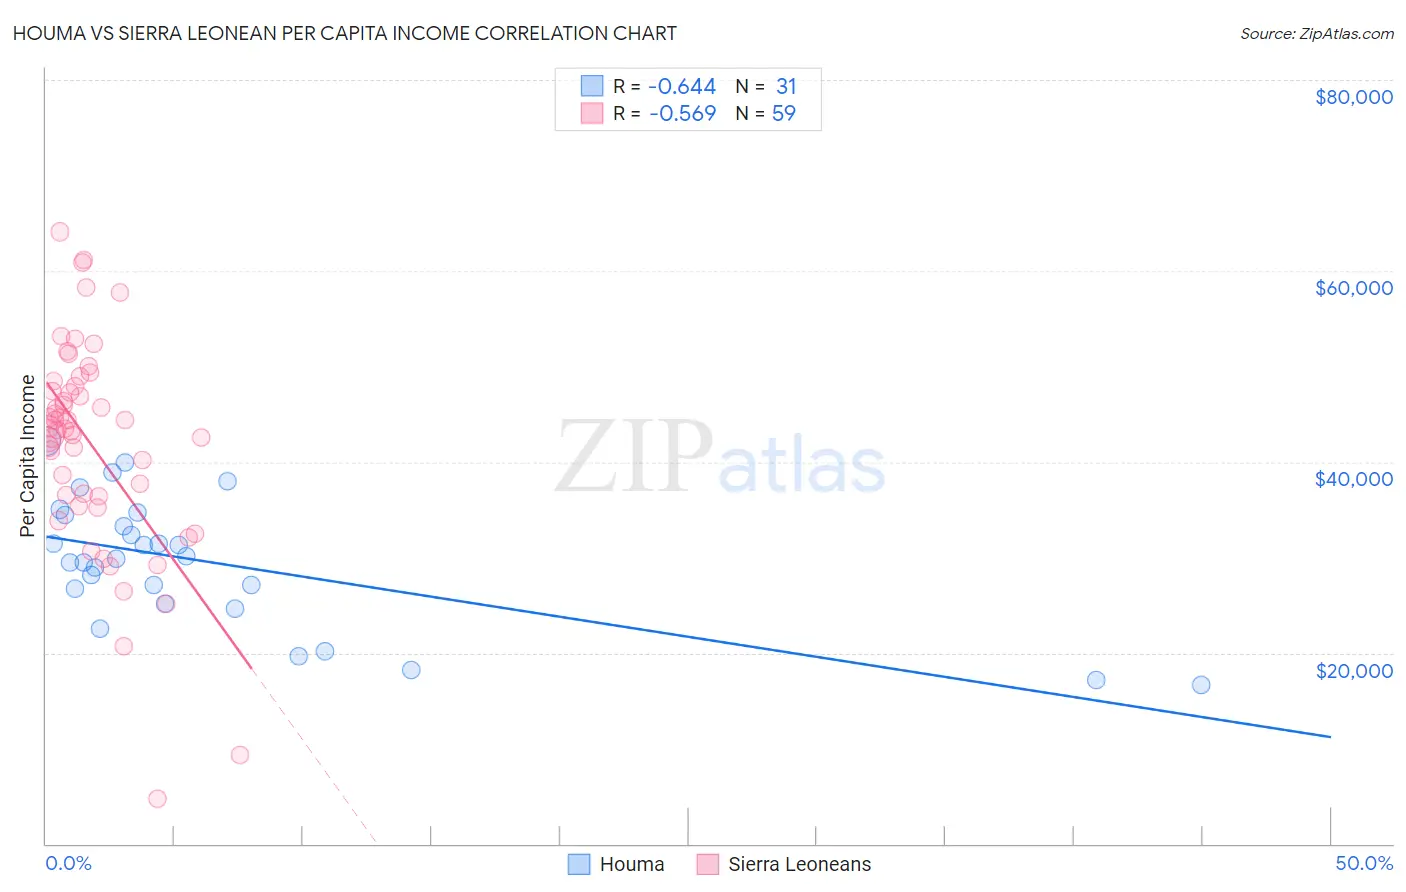
Houma vs Sierra Leonean Per Capita Income Correlation Chart
The statistical analysis conducted on geographies consisting of 36,799,095 people shows a significant negative correlation between the proportion of Houma and per capita income in the United States with a correlation coefficient (R) of -0.644 and weighted average of $32,996. Similarly, the statistical analysis conducted on geographies consisting of 83,350,653 people shows a substantial negative correlation between the proportion of Sierra Leoneans and per capita income in the United States with a correlation coefficient (R) of -0.569 and weighted average of $43,405, a difference of 31.6%.
Per Capita Income Correlation Summary
| Measurement | Houma | Sierra Leonean |
| Minimum | $16,626 | $4,657 |
| Maximum | $42,187 | $64,096 |
| Range | $25,561 | $59,439 |
| Mean | $29,455 | $41,867 |
| Median | $29,877 | $43,497 |
| Interquartile 25% (IQ1) | $25,090 | $36,386 |
| Interquartile 75% (IQ3) | $34,460 | $47,973 |
| Interquartile Range (IQR) | $9,370 | $11,587 |
| Standard Deviation (Sample) | $6,714 | $11,153 |
| Standard Deviation (Population) | $6,604 | $11,058 |
Similar Demographics by Per Capita Income
Demographics Similar to Houma by Per Capita Income
In terms of per capita income, the demographic groups most similar to Houma are Yakama ($33,009, a difference of 0.040%), Yuman ($33,236, a difference of 0.73%), Native/Alaskan ($33,279, a difference of 0.86%), Arapaho ($32,345, a difference of 2.0%), and Immigrants from Yemen ($33,696, a difference of 2.1%).
| Demographics | Rating | Rank | Per Capita Income |
| Spanish American Indians | 0.0 /100 | #330 | Tragic $34,195 |
| Immigrants | Mexico | 0.0 /100 | #331 | Tragic $33,931 |
| Sioux | 0.0 /100 | #332 | Tragic $33,921 |
| Immigrants | Yemen | 0.0 /100 | #333 | Tragic $33,696 |
| Natives/Alaskans | 0.0 /100 | #334 | Tragic $33,279 |
| Yuman | 0.0 /100 | #335 | Tragic $33,236 |
| Yakama | 0.0 /100 | #336 | Tragic $33,009 |
| Houma | 0.0 /100 | #337 | Tragic $32,996 |
| Arapaho | 0.0 /100 | #338 | Tragic $32,345 |
| Pueblo | 0.0 /100 | #339 | Tragic $32,012 |
| Crow | 0.0 /100 | #340 | Tragic $31,729 |
| Puerto Ricans | 0.0 /100 | #341 | Tragic $31,268 |
| Hopi | 0.0 /100 | #342 | Tragic $31,177 |
| Pima | 0.0 /100 | #343 | Tragic $30,644 |
| Yup'ik | 0.0 /100 | #344 | Tragic $30,518 |
Demographics Similar to Sierra Leoneans by Per Capita Income
In terms of per capita income, the demographic groups most similar to Sierra Leoneans are Finnish ($43,461, a difference of 0.13%), Immigrants from Costa Rica ($43,464, a difference of 0.14%), Tlingit-Haida ($43,516, a difference of 0.25%), Immigrants from South Eastern Asia ($43,539, a difference of 0.31%), and Welsh ($43,233, a difference of 0.40%).
| Demographics | Rating | Rank | Per Capita Income |
| French | 50.7 /100 | #173 | Average $43,685 |
| Colombians | 50.0 /100 | #174 | Average $43,661 |
| Celtics | 48.9 /100 | #175 | Average $43,621 |
| Immigrants | South Eastern Asia | 46.6 /100 | #176 | Average $43,539 |
| Tlingit-Haida | 45.9 /100 | #177 | Average $43,516 |
| Immigrants | Costa Rica | 44.5 /100 | #178 | Average $43,464 |
| Finns | 44.4 /100 | #179 | Average $43,461 |
| Sierra Leoneans | 42.9 /100 | #180 | Average $43,405 |
| Welsh | 38.2 /100 | #181 | Fair $43,233 |
| Immigrants | Vietnam | 38.1 /100 | #182 | Fair $43,229 |
| Germans | 33.9 /100 | #183 | Fair $43,067 |
| Spaniards | 32.9 /100 | #184 | Fair $43,028 |
| Immigrants | Immigrants | 32.5 /100 | #185 | Fair $43,010 |
| French Canadians | 32.3 /100 | #186 | Fair $43,003 |
| Immigrants | Colombia | 31.5 /100 | #187 | Fair $42,971 |