Australian vs Hawaiian Per Capita Income
COMPARE
Australian
Hawaiian
Per Capita Income
Per Capita Income Comparison
Australians
Hawaiians
$52,074
PER CAPITA INCOME
100.0/ 100
METRIC RATING
33rd/ 347
METRIC RANK
$39,403
PER CAPITA INCOME
0.8/ 100
METRIC RATING
256th/ 347
METRIC RANK
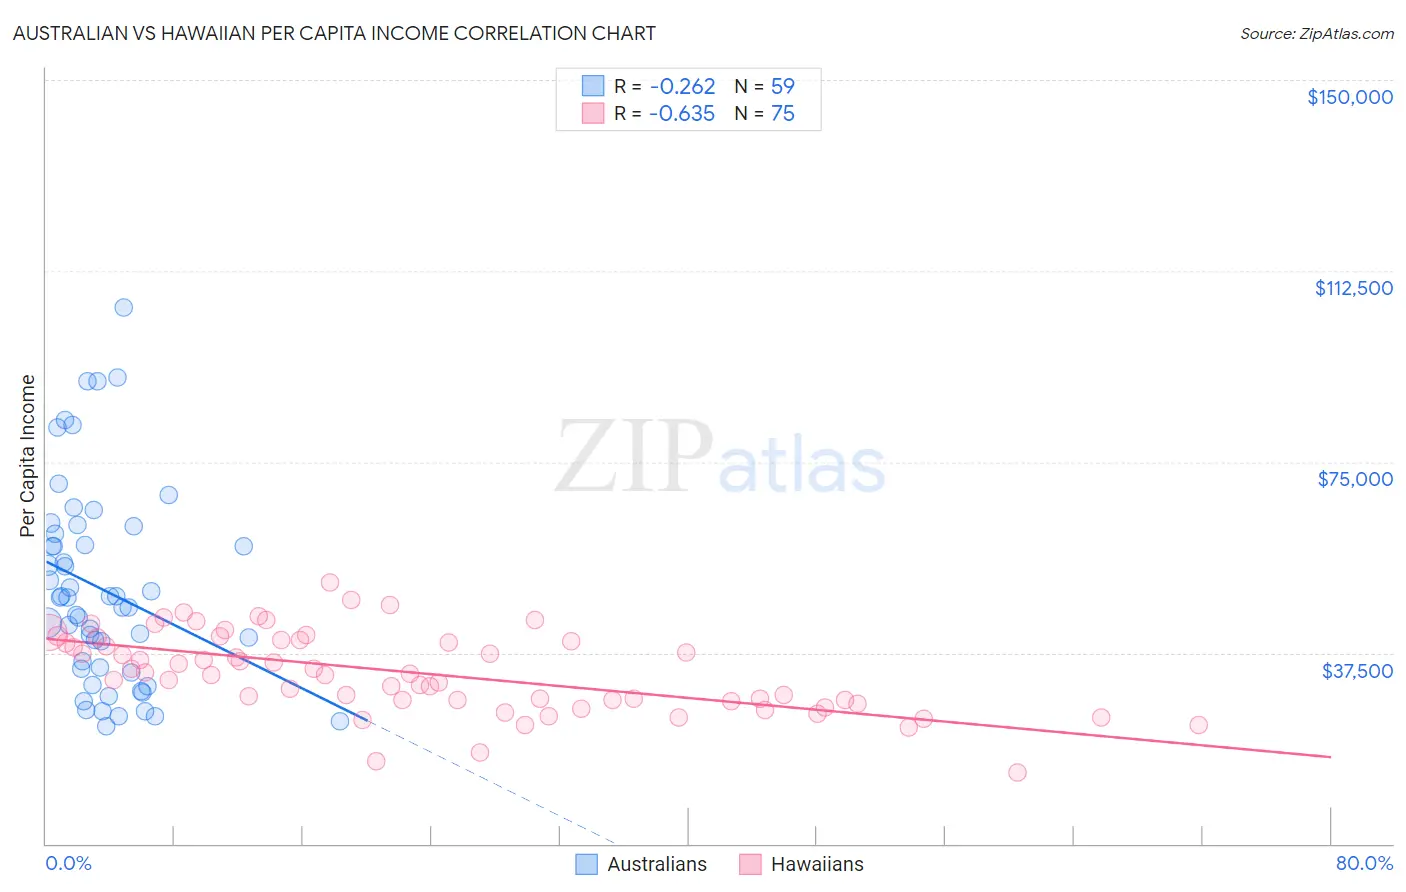
Australian vs Hawaiian Per Capita Income Correlation Chart
The statistical analysis conducted on geographies consisting of 224,126,696 people shows a weak negative correlation between the proportion of Australians and per capita income in the United States with a correlation coefficient (R) of -0.262 and weighted average of $52,074. Similarly, the statistical analysis conducted on geographies consisting of 327,629,067 people shows a significant negative correlation between the proportion of Hawaiians and per capita income in the United States with a correlation coefficient (R) of -0.635 and weighted average of $39,403, a difference of 32.2%.
Per Capita Income Correlation Summary
| Measurement | Australian | Hawaiian |
| Minimum | $23,081 | $14,082 |
| Maximum | $105,254 | $51,335 |
| Range | $82,173 | $37,253 |
| Mean | $49,891 | $33,620 |
| Median | $48,296 | $33,340 |
| Interquartile 25% (IQ1) | $34,284 | $28,161 |
| Interquartile 75% (IQ3) | $60,948 | $40,110 |
| Interquartile Range (IQR) | $26,664 | $11,949 |
| Standard Deviation (Sample) | $19,453 | $7,838 |
| Standard Deviation (Population) | $19,287 | $7,785 |
Similar Demographics by Per Capita Income
Demographics Similar to Australians by Per Capita Income
In terms of per capita income, the demographic groups most similar to Australians are Immigrants from Russia ($52,044, a difference of 0.060%), Burmese ($52,005, a difference of 0.13%), Immigrants from Norway ($52,217, a difference of 0.27%), Immigrants from Greece ($51,891, a difference of 0.35%), and Estonian ($51,875, a difference of 0.38%).
| Demographics | Rating | Rank | Per Capita Income |
| Russians | 100.0 /100 | #26 | Exceptional $53,154 |
| Immigrants | South Central Asia | 100.0 /100 | #27 | Exceptional $52,660 |
| Latvians | 100.0 /100 | #28 | Exceptional $52,649 |
| Israelis | 100.0 /100 | #29 | Exceptional $52,596 |
| Immigrants | Austria | 100.0 /100 | #30 | Exceptional $52,503 |
| Turks | 100.0 /100 | #31 | Exceptional $52,391 |
| Immigrants | Norway | 100.0 /100 | #32 | Exceptional $52,217 |
| Australians | 100.0 /100 | #33 | Exceptional $52,074 |
| Immigrants | Russia | 100.0 /100 | #34 | Exceptional $52,044 |
| Burmese | 100.0 /100 | #35 | Exceptional $52,005 |
| Immigrants | Greece | 100.0 /100 | #36 | Exceptional $51,891 |
| Estonians | 100.0 /100 | #37 | Exceptional $51,875 |
| Immigrants | Czechoslovakia | 100.0 /100 | #38 | Exceptional $51,770 |
| Cambodians | 100.0 /100 | #39 | Exceptional $51,731 |
| Immigrants | Korea | 100.0 /100 | #40 | Exceptional $51,671 |
Demographics Similar to Hawaiians by Per Capita Income
In terms of per capita income, the demographic groups most similar to Hawaiians are Nicaraguan ($39,372, a difference of 0.080%), Immigrants from Middle Africa ($39,529, a difference of 0.32%), Alaska Native ($39,558, a difference of 0.39%), Osage ($39,568, a difference of 0.42%), and Jamaican ($39,231, a difference of 0.44%).
| Demographics | Rating | Rank | Per Capita Income |
| Japanese | 1.4 /100 | #249 | Tragic $39,870 |
| Immigrants | Burma/Myanmar | 1.3 /100 | #250 | Tragic $39,827 |
| Samoans | 1.3 /100 | #251 | Tragic $39,826 |
| Immigrants | Azores | 1.0 /100 | #252 | Tragic $39,608 |
| Osage | 1.0 /100 | #253 | Tragic $39,568 |
| Alaska Natives | 1.0 /100 | #254 | Tragic $39,558 |
| Immigrants | Middle Africa | 1.0 /100 | #255 | Tragic $39,529 |
| Hawaiians | 0.8 /100 | #256 | Tragic $39,403 |
| Nicaraguans | 0.8 /100 | #257 | Tragic $39,372 |
| Jamaicans | 0.7 /100 | #258 | Tragic $39,231 |
| Malaysians | 0.7 /100 | #259 | Tragic $39,194 |
| Alaskan Athabascans | 0.6 /100 | #260 | Tragic $39,163 |
| Marshallese | 0.6 /100 | #261 | Tragic $39,108 |
| Iroquois | 0.6 /100 | #262 | Tragic $39,104 |
| Belizeans | 0.6 /100 | #263 | Tragic $39,097 |