Houma vs Hawaiian 3rd Grade
COMPARE
Houma
Hawaiian
3rd Grade
3rd Grade Comparison
Houma
Hawaiians
97.1%
3RD GRADE
0.1/ 100
METRIC RATING
283rd/ 347
METRIC RANK
97.7%
3RD GRADE
25.7/ 100
METRIC RATING
197th/ 347
METRIC RANK
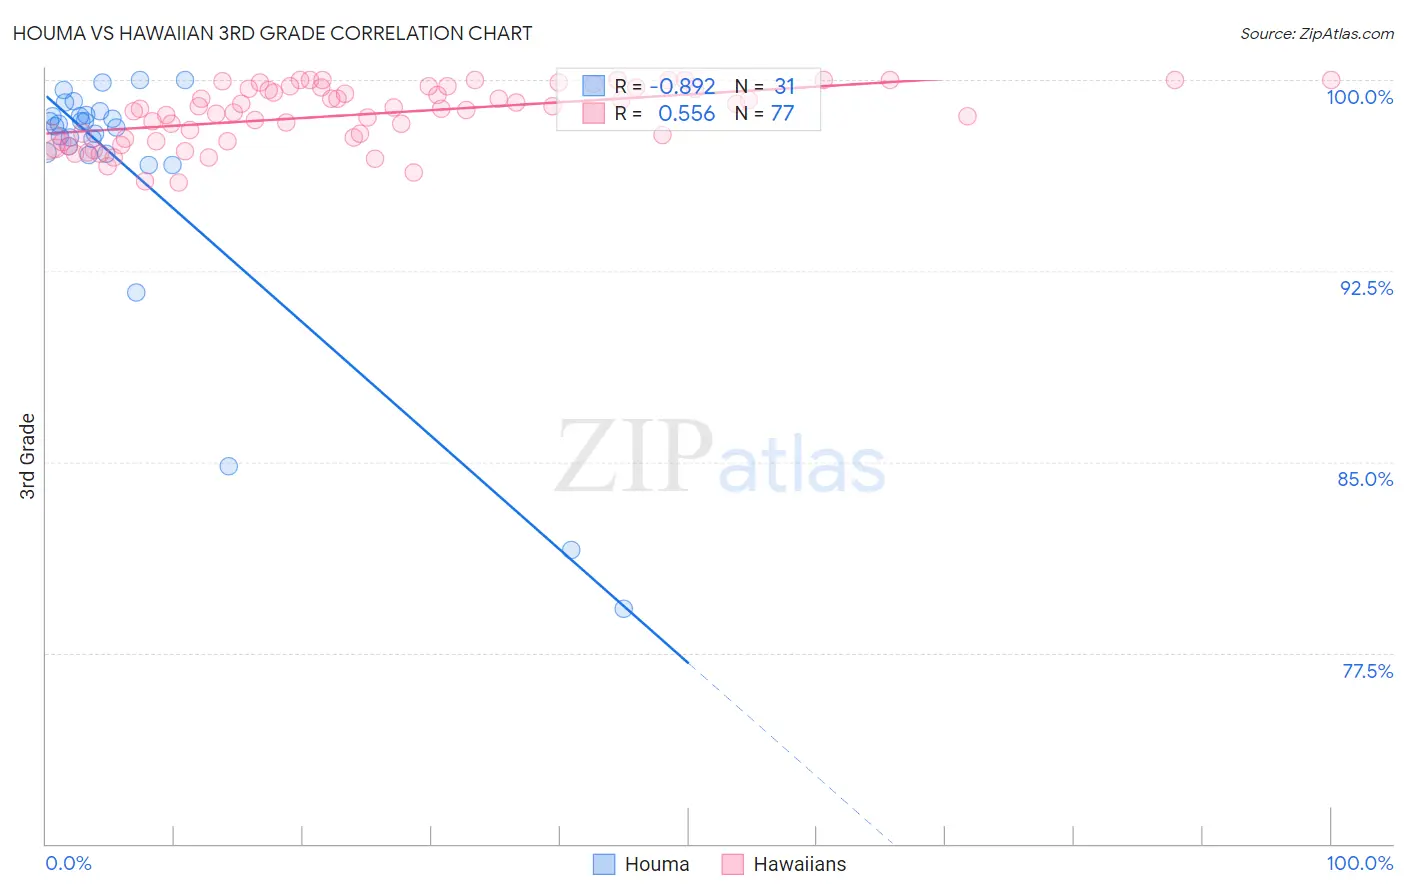
Houma vs Hawaiian 3rd Grade Correlation Chart
The statistical analysis conducted on geographies consisting of 36,795,916 people shows a very strong negative correlation between the proportion of Houma and percentage of population with at least 3rd grade education in the United States with a correlation coefficient (R) of -0.892 and weighted average of 97.1%. Similarly, the statistical analysis conducted on geographies consisting of 327,621,279 people shows a substantial positive correlation between the proportion of Hawaiians and percentage of population with at least 3rd grade education in the United States with a correlation coefficient (R) of 0.556 and weighted average of 97.7%, a difference of 0.55%.
3rd Grade Correlation Summary
| Measurement | Houma | Hawaiian |
| Minimum | 79.2% | 96.0% |
| Maximum | 100.0% | 100.0% |
| Range | 20.8% | 4.0% |
| Mean | 96.5% | 98.7% |
| Median | 98.2% | 98.9% |
| Interquartile 25% (IQ1) | 97.1% | 97.7% |
| Interquartile 75% (IQ3) | 98.6% | 99.7% |
| Interquartile Range (IQR) | 1.5% | 2.0% |
| Standard Deviation (Sample) | 5.1% | 1.1% |
| Standard Deviation (Population) | 5.1% | 1.1% |
Similar Demographics by 3rd Grade
Demographics Similar to Houma by 3rd Grade
In terms of 3rd grade, the demographic groups most similar to Houma are Afghan (97.1%, a difference of 0.0%), Immigrants from Philippines (97.2%, a difference of 0.020%), Immigrants from Ghana (97.2%, a difference of 0.020%), Barbadian (97.2%, a difference of 0.020%), and Immigrants from Trinidad and Tobago (97.1%, a difference of 0.020%).
| Demographics | Rating | Rank | 3rd Grade |
| Immigrants | Bolivia | 0.1 /100 | #276 | Tragic 97.2% |
| Trinidadians and Tobagonians | 0.1 /100 | #277 | Tragic 97.2% |
| Immigrants | Western Africa | 0.1 /100 | #278 | Tragic 97.2% |
| Immigrants | Philippines | 0.1 /100 | #279 | Tragic 97.2% |
| Immigrants | Ghana | 0.1 /100 | #280 | Tragic 97.2% |
| Barbadians | 0.1 /100 | #281 | Tragic 97.2% |
| Afghans | 0.1 /100 | #282 | Tragic 97.1% |
| Houma | 0.1 /100 | #283 | Tragic 97.1% |
| Immigrants | Trinidad and Tobago | 0.0 /100 | #284 | Tragic 97.1% |
| Immigrants | Hong Kong | 0.0 /100 | #285 | Tragic 97.1% |
| Immigrants | Barbados | 0.0 /100 | #286 | Tragic 97.1% |
| Immigrants | St. Vincent and the Grenadines | 0.0 /100 | #287 | Tragic 97.1% |
| Immigrants | West Indies | 0.0 /100 | #288 | Tragic 97.1% |
| Immigrants | Thailand | 0.0 /100 | #289 | Tragic 97.1% |
| Immigrants | Portugal | 0.0 /100 | #290 | Tragic 97.0% |
Demographics Similar to Hawaiians by 3rd Grade
In terms of 3rd grade, the demographic groups most similar to Hawaiians are Immigrants from Egypt (97.7%, a difference of 0.0%), Paraguayan (97.7%, a difference of 0.0%), Mongolian (97.7%, a difference of 0.010%), Immigrants from Kenya (97.7%, a difference of 0.010%), and Immigrants from Uganda (97.7%, a difference of 0.010%).
| Demographics | Rating | Rank | 3rd Grade |
| Panamanians | 31.5 /100 | #190 | Fair 97.7% |
| Blacks/African Americans | 29.6 /100 | #191 | Fair 97.7% |
| Mongolians | 29.1 /100 | #192 | Fair 97.7% |
| Immigrants | Kenya | 28.2 /100 | #193 | Fair 97.7% |
| Immigrants | Uganda | 27.4 /100 | #194 | Fair 97.7% |
| Immigrants | Egypt | 26.8 /100 | #195 | Fair 97.7% |
| Paraguayans | 26.2 /100 | #196 | Fair 97.7% |
| Hawaiians | 25.7 /100 | #197 | Fair 97.7% |
| Guamanians/Chamorros | 23.6 /100 | #198 | Fair 97.7% |
| Immigrants | Ukraine | 22.7 /100 | #199 | Fair 97.7% |
| Immigrants | Albania | 22.6 /100 | #200 | Fair 97.7% |
| Immigrants | Lebanon | 21.7 /100 | #201 | Fair 97.7% |
| Immigrants | Southern Europe | 17.7 /100 | #202 | Poor 97.6% |
| Paiute | 16.7 /100 | #203 | Poor 97.6% |
| Immigrants | Chile | 16.5 /100 | #204 | Poor 97.6% |