Houma vs Russian Per Capita Income
COMPARE
Houma
Russian
Per Capita Income
Per Capita Income Comparison
Houma
Russians
$32,996
PER CAPITA INCOME
0.0/ 100
METRIC RATING
337th/ 347
METRIC RANK
$53,154
PER CAPITA INCOME
100.0/ 100
METRIC RATING
26th/ 347
METRIC RANK
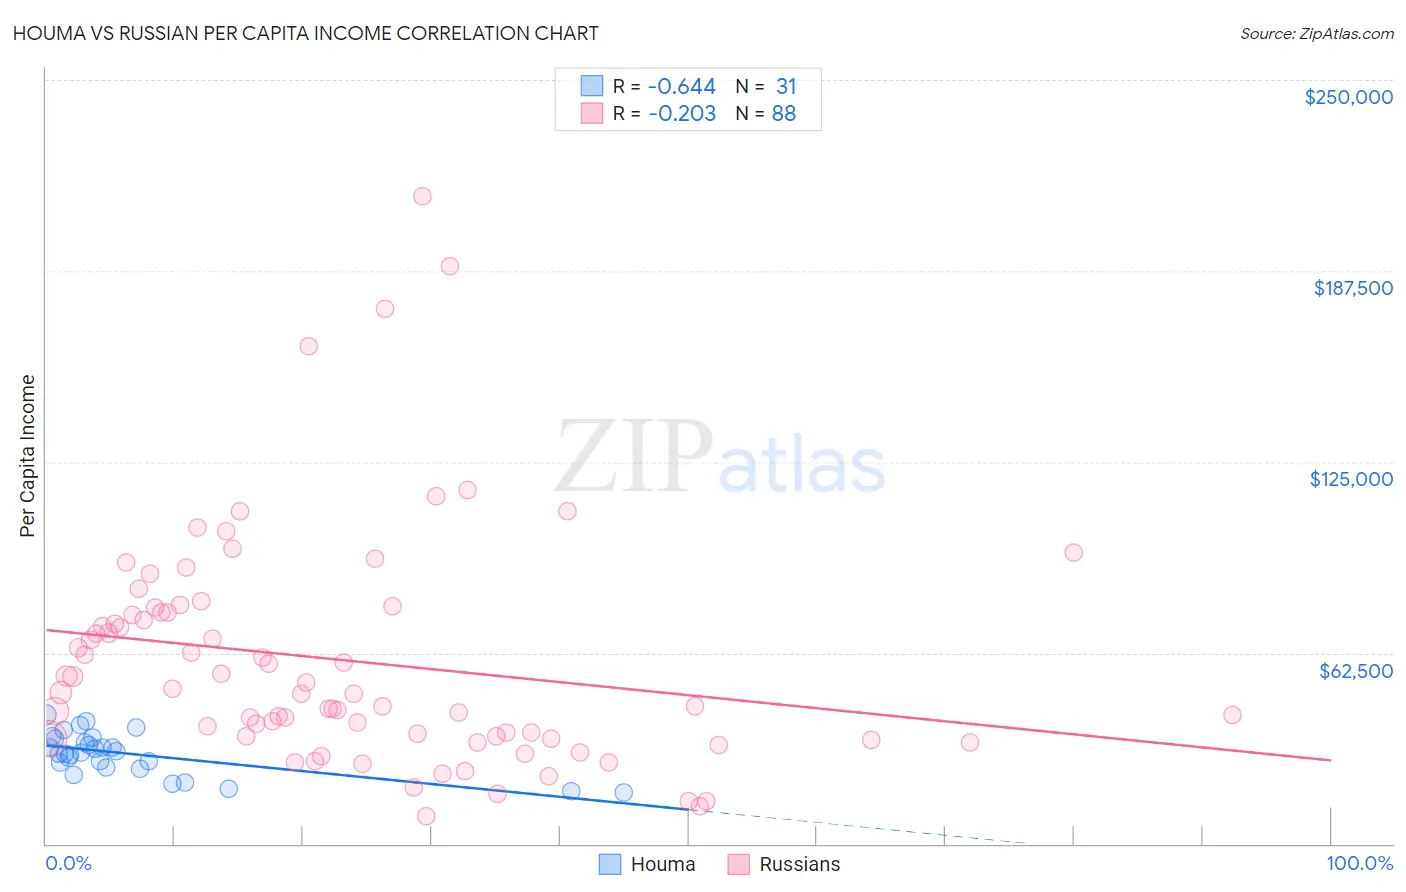
Houma vs Russian Per Capita Income Correlation Chart
The statistical analysis conducted on geographies consisting of 36,799,095 people shows a significant negative correlation between the proportion of Houma and per capita income in the United States with a correlation coefficient (R) of -0.644 and weighted average of $32,996. Similarly, the statistical analysis conducted on geographies consisting of 512,304,099 people shows a weak negative correlation between the proportion of Russians and per capita income in the United States with a correlation coefficient (R) of -0.203 and weighted average of $53,154, a difference of 61.1%.
Per Capita Income Correlation Summary
| Measurement | Houma | Russian |
| Minimum | $16,626 | $9,193 |
| Maximum | $42,187 | $212,036 |
| Range | $25,561 | $202,843 |
| Mean | $29,455 | $59,937 |
| Median | $29,877 | $49,383 |
| Interquartile 25% (IQ1) | $25,090 | $34,688 |
| Interquartile 75% (IQ3) | $34,460 | $75,613 |
| Interquartile Range (IQR) | $9,370 | $40,926 |
| Standard Deviation (Sample) | $6,714 | $37,845 |
| Standard Deviation (Population) | $6,604 | $37,630 |
Similar Demographics by Per Capita Income
Demographics Similar to Houma by Per Capita Income
In terms of per capita income, the demographic groups most similar to Houma are Yakama ($33,009, a difference of 0.040%), Yuman ($33,236, a difference of 0.73%), Native/Alaskan ($33,279, a difference of 0.86%), Arapaho ($32,345, a difference of 2.0%), and Immigrants from Yemen ($33,696, a difference of 2.1%).
| Demographics | Rating | Rank | Per Capita Income |
| Spanish American Indians | 0.0 /100 | #330 | Tragic $34,195 |
| Immigrants | Mexico | 0.0 /100 | #331 | Tragic $33,931 |
| Sioux | 0.0 /100 | #332 | Tragic $33,921 |
| Immigrants | Yemen | 0.0 /100 | #333 | Tragic $33,696 |
| Natives/Alaskans | 0.0 /100 | #334 | Tragic $33,279 |
| Yuman | 0.0 /100 | #335 | Tragic $33,236 |
| Yakama | 0.0 /100 | #336 | Tragic $33,009 |
| Houma | 0.0 /100 | #337 | Tragic $32,996 |
| Arapaho | 0.0 /100 | #338 | Tragic $32,345 |
| Pueblo | 0.0 /100 | #339 | Tragic $32,012 |
| Crow | 0.0 /100 | #340 | Tragic $31,729 |
| Puerto Ricans | 0.0 /100 | #341 | Tragic $31,268 |
| Hopi | 0.0 /100 | #342 | Tragic $31,177 |
| Pima | 0.0 /100 | #343 | Tragic $30,644 |
| Yup'ik | 0.0 /100 | #344 | Tragic $30,518 |
Demographics Similar to Russians by Per Capita Income
In terms of per capita income, the demographic groups most similar to Russians are Immigrants from Japan ($53,359, a difference of 0.39%), Immigrants from South Central Asia ($52,660, a difference of 0.94%), Latvian ($52,649, a difference of 0.96%), Israeli ($52,596, a difference of 1.1%), and Immigrants from Denmark ($53,799, a difference of 1.2%).
| Demographics | Rating | Rank | Per Capita Income |
| Immigrants | China | 100.0 /100 | #19 | Exceptional $54,264 |
| Soviet Union | 100.0 /100 | #20 | Exceptional $54,202 |
| Immigrants | Northern Europe | 100.0 /100 | #21 | Exceptional $54,159 |
| Indians (Asian) | 100.0 /100 | #22 | Exceptional $53,874 |
| Immigrants | Eastern Asia | 100.0 /100 | #23 | Exceptional $53,806 |
| Immigrants | Denmark | 100.0 /100 | #24 | Exceptional $53,799 |
| Immigrants | Japan | 100.0 /100 | #25 | Exceptional $53,359 |
| Russians | 100.0 /100 | #26 | Exceptional $53,154 |
| Immigrants | South Central Asia | 100.0 /100 | #27 | Exceptional $52,660 |
| Latvians | 100.0 /100 | #28 | Exceptional $52,649 |
| Israelis | 100.0 /100 | #29 | Exceptional $52,596 |
| Immigrants | Austria | 100.0 /100 | #30 | Exceptional $52,503 |
| Turks | 100.0 /100 | #31 | Exceptional $52,391 |
| Immigrants | Norway | 100.0 /100 | #32 | Exceptional $52,217 |
| Australians | 100.0 /100 | #33 | Exceptional $52,074 |