Houma vs Yuman Per Capita Income
COMPARE
Houma
Yuman
Per Capita Income
Per Capita Income Comparison
Houma
Yuman
$32,996
PER CAPITA INCOME
0.0/ 100
METRIC RATING
337th/ 347
METRIC RANK
$33,236
PER CAPITA INCOME
0.0/ 100
METRIC RATING
335th/ 347
METRIC RANK
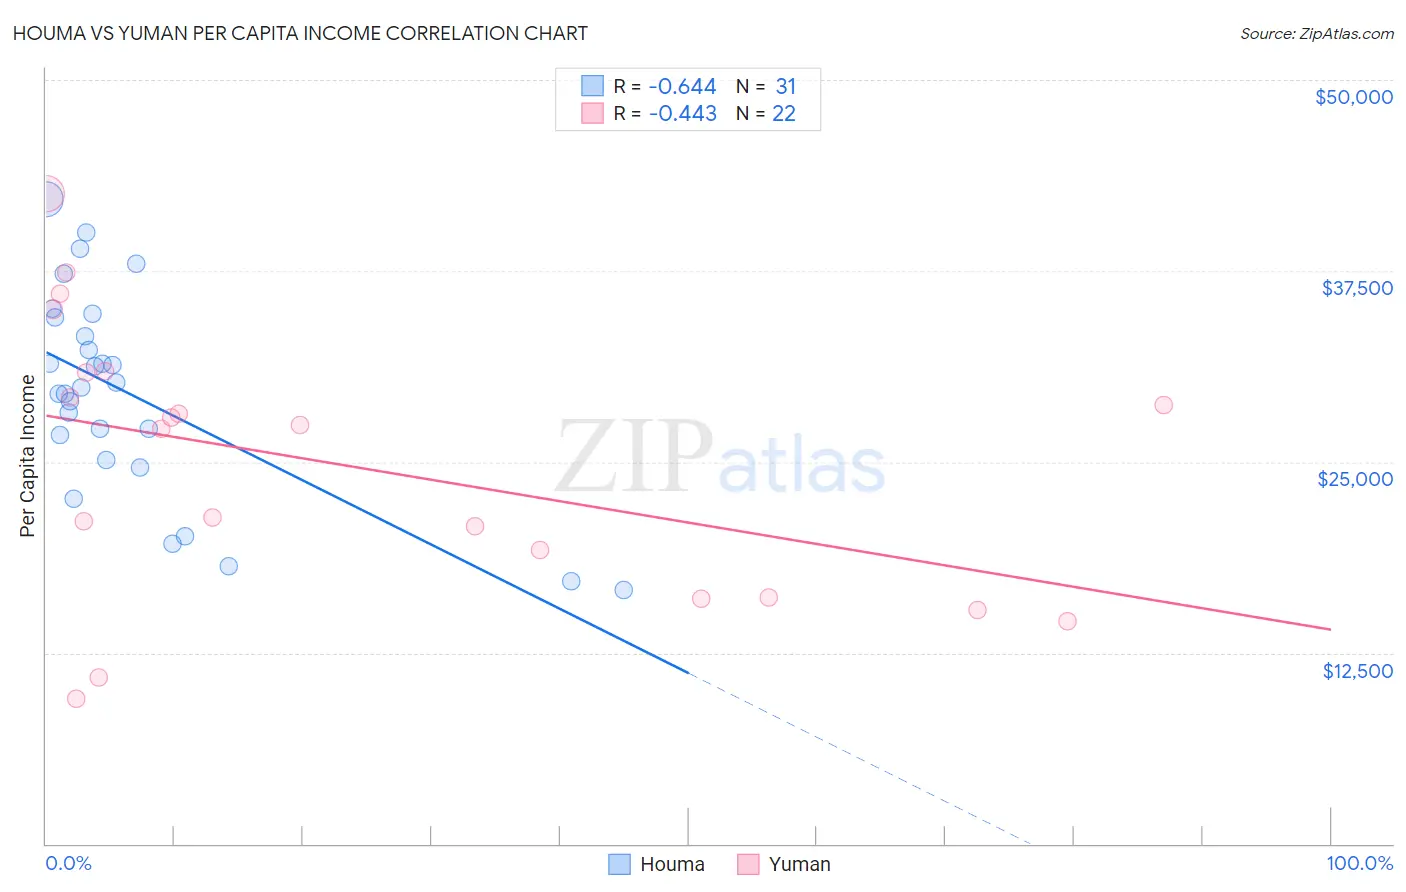
Houma vs Yuman Per Capita Income Correlation Chart
The statistical analysis conducted on geographies consisting of 36,799,095 people shows a significant negative correlation between the proportion of Houma and per capita income in the United States with a correlation coefficient (R) of -0.644 and weighted average of $32,996. Similarly, the statistical analysis conducted on geographies consisting of 40,696,310 people shows a moderate negative correlation between the proportion of Yuman and per capita income in the United States with a correlation coefficient (R) of -0.443 and weighted average of $33,236, a difference of 0.73%.
Per Capita Income Correlation Summary
| Measurement | Houma | Yuman |
| Minimum | $16,626 | $9,533 |
| Maximum | $42,187 | $42,569 |
| Range | $25,561 | $33,036 |
| Mean | $29,455 | $24,831 |
| Median | $29,877 | $27,284 |
| Interquartile 25% (IQ1) | $25,090 | $16,137 |
| Interquartile 75% (IQ3) | $34,460 | $30,879 |
| Interquartile Range (IQR) | $9,370 | $14,742 |
| Standard Deviation (Sample) | $6,714 | $8,979 |
| Standard Deviation (Population) | $6,604 | $8,772 |
Demographics Similar to Houma and Yuman by Per Capita Income
In terms of per capita income, the demographic groups most similar to Houma are Yakama ($33,009, a difference of 0.040%), Native/Alaskan ($33,279, a difference of 0.86%), Arapaho ($32,345, a difference of 2.0%), Immigrants from Yemen ($33,696, a difference of 2.1%), and Sioux ($33,921, a difference of 2.8%). Similarly, the demographic groups most similar to Yuman are Native/Alaskan ($33,279, a difference of 0.13%), Yakama ($33,009, a difference of 0.69%), Immigrants from Yemen ($33,696, a difference of 1.4%), Sioux ($33,921, a difference of 2.1%), and Immigrants from Mexico ($33,931, a difference of 2.1%).
| Demographics | Rating | Rank | Per Capita Income |
| Immigrants | Cuba | 0.0 /100 | #326 | Tragic $34,910 |
| Apache | 0.0 /100 | #327 | Tragic $34,886 |
| Menominee | 0.0 /100 | #328 | Tragic $34,578 |
| Mexicans | 0.0 /100 | #329 | Tragic $34,559 |
| Spanish American Indians | 0.0 /100 | #330 | Tragic $34,195 |
| Immigrants | Mexico | 0.0 /100 | #331 | Tragic $33,931 |
| Sioux | 0.0 /100 | #332 | Tragic $33,921 |
| Immigrants | Yemen | 0.0 /100 | #333 | Tragic $33,696 |
| Natives/Alaskans | 0.0 /100 | #334 | Tragic $33,279 |
| Yuman | 0.0 /100 | #335 | Tragic $33,236 |
| Yakama | 0.0 /100 | #336 | Tragic $33,009 |
| Houma | 0.0 /100 | #337 | Tragic $32,996 |
| Arapaho | 0.0 /100 | #338 | Tragic $32,345 |
| Pueblo | 0.0 /100 | #339 | Tragic $32,012 |
| Crow | 0.0 /100 | #340 | Tragic $31,729 |
| Puerto Ricans | 0.0 /100 | #341 | Tragic $31,268 |
| Hopi | 0.0 /100 | #342 | Tragic $31,177 |
| Pima | 0.0 /100 | #343 | Tragic $30,644 |
| Yup'ik | 0.0 /100 | #344 | Tragic $30,518 |
| Tohono O'odham | 0.0 /100 | #345 | Tragic $30,256 |
| Lumbee | 0.0 /100 | #346 | Tragic $29,845 |