Houma vs Immigrants from Uruguay Per Capita Income
COMPARE
Houma
Immigrants from Uruguay
Per Capita Income
Per Capita Income Comparison
Houma
Immigrants from Uruguay
$32,996
PER CAPITA INCOME
0.0/ 100
METRIC RATING
337th/ 347
METRIC RANK
$43,997
PER CAPITA INCOME
59.3/ 100
METRIC RATING
166th/ 347
METRIC RANK
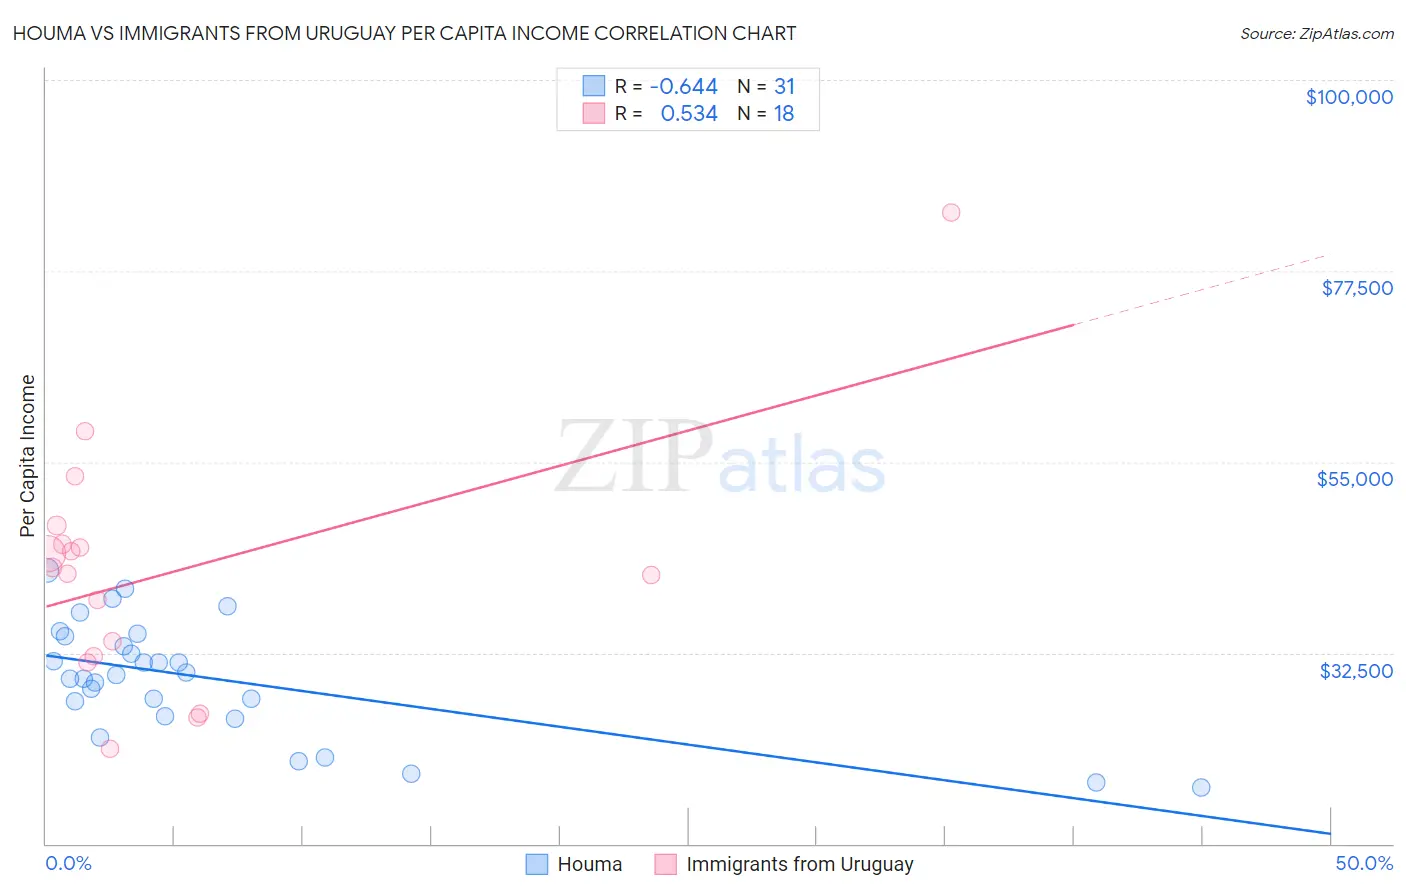
Houma vs Immigrants from Uruguay Per Capita Income Correlation Chart
The statistical analysis conducted on geographies consisting of 36,799,095 people shows a significant negative correlation between the proportion of Houma and per capita income in the United States with a correlation coefficient (R) of -0.644 and weighted average of $32,996. Similarly, the statistical analysis conducted on geographies consisting of 133,259,667 people shows a substantial positive correlation between the proportion of Immigrants from Uruguay and per capita income in the United States with a correlation coefficient (R) of 0.534 and weighted average of $43,997, a difference of 33.3%.
Per Capita Income Correlation Summary
| Measurement | Houma | Immigrants from Uruguay |
| Minimum | $16,626 | $21,194 |
| Maximum | $42,187 | $84,313 |
| Range | $25,561 | $63,119 |
| Mean | $29,455 | $42,012 |
| Median | $29,877 | $42,230 |
| Interquartile 25% (IQ1) | $25,090 | $32,137 |
| Interquartile 75% (IQ3) | $34,460 | $45,280 |
| Interquartile Range (IQR) | $9,370 | $13,143 |
| Standard Deviation (Sample) | $6,714 | $14,447 |
| Standard Deviation (Population) | $6,604 | $14,040 |
Similar Demographics by Per Capita Income
Demographics Similar to Houma by Per Capita Income
In terms of per capita income, the demographic groups most similar to Houma are Yakama ($33,009, a difference of 0.040%), Yuman ($33,236, a difference of 0.73%), Native/Alaskan ($33,279, a difference of 0.86%), Arapaho ($32,345, a difference of 2.0%), and Immigrants from Yemen ($33,696, a difference of 2.1%).
| Demographics | Rating | Rank | Per Capita Income |
| Spanish American Indians | 0.0 /100 | #330 | Tragic $34,195 |
| Immigrants | Mexico | 0.0 /100 | #331 | Tragic $33,931 |
| Sioux | 0.0 /100 | #332 | Tragic $33,921 |
| Immigrants | Yemen | 0.0 /100 | #333 | Tragic $33,696 |
| Natives/Alaskans | 0.0 /100 | #334 | Tragic $33,279 |
| Yuman | 0.0 /100 | #335 | Tragic $33,236 |
| Yakama | 0.0 /100 | #336 | Tragic $33,009 |
| Houma | 0.0 /100 | #337 | Tragic $32,996 |
| Arapaho | 0.0 /100 | #338 | Tragic $32,345 |
| Pueblo | 0.0 /100 | #339 | Tragic $32,012 |
| Crow | 0.0 /100 | #340 | Tragic $31,729 |
| Puerto Ricans | 0.0 /100 | #341 | Tragic $31,268 |
| Hopi | 0.0 /100 | #342 | Tragic $31,177 |
| Pima | 0.0 /100 | #343 | Tragic $30,644 |
| Yup'ik | 0.0 /100 | #344 | Tragic $30,518 |
Demographics Similar to Immigrants from Uruguay by Per Capita Income
In terms of per capita income, the demographic groups most similar to Immigrants from Uruguay are Immigrants from Philippines ($44,000, a difference of 0.010%), English ($43,982, a difference of 0.030%), Sri Lankan ($44,014, a difference of 0.040%), Belgian ($43,951, a difference of 0.10%), and Immigrants from South America ($44,068, a difference of 0.16%).
| Demographics | Rating | Rank | Per Capita Income |
| South Americans | 62.4 /100 | #159 | Good $44,114 |
| Danes | 61.9 /100 | #160 | Good $44,095 |
| Costa Ricans | 61.8 /100 | #161 | Good $44,090 |
| Swiss | 61.4 /100 | #162 | Good $44,076 |
| Immigrants | South America | 61.2 /100 | #163 | Good $44,068 |
| Sri Lankans | 59.8 /100 | #164 | Average $44,014 |
| Immigrants | Philippines | 59.4 /100 | #165 | Average $44,000 |
| Immigrants | Uruguay | 59.3 /100 | #166 | Average $43,997 |
| English | 58.9 /100 | #167 | Average $43,982 |
| Belgians | 58.1 /100 | #168 | Average $43,951 |
| Immigrants | Peru | 55.3 /100 | #169 | Average $43,852 |
| Scandinavians | 55.2 /100 | #170 | Average $43,848 |
| Immigrants | Eastern Africa | 54.9 /100 | #171 | Average $43,838 |
| Czechoslovakians | 54.1 /100 | #172 | Average $43,806 |
| French | 50.7 /100 | #173 | Average $43,685 |