Honduran vs Italian Wage/Income Gap
COMPARE
Honduran
Italian
Wage/Income Gap
Wage/Income Gap Comparison
Hondurans
Italians
23.6%
WAGE/INCOME GAP
99.5/ 100
METRIC RATING
94th/ 347
METRIC RANK
28.1%
WAGE/INCOME GAP
0.4/ 100
METRIC RATING
285th/ 347
METRIC RANK
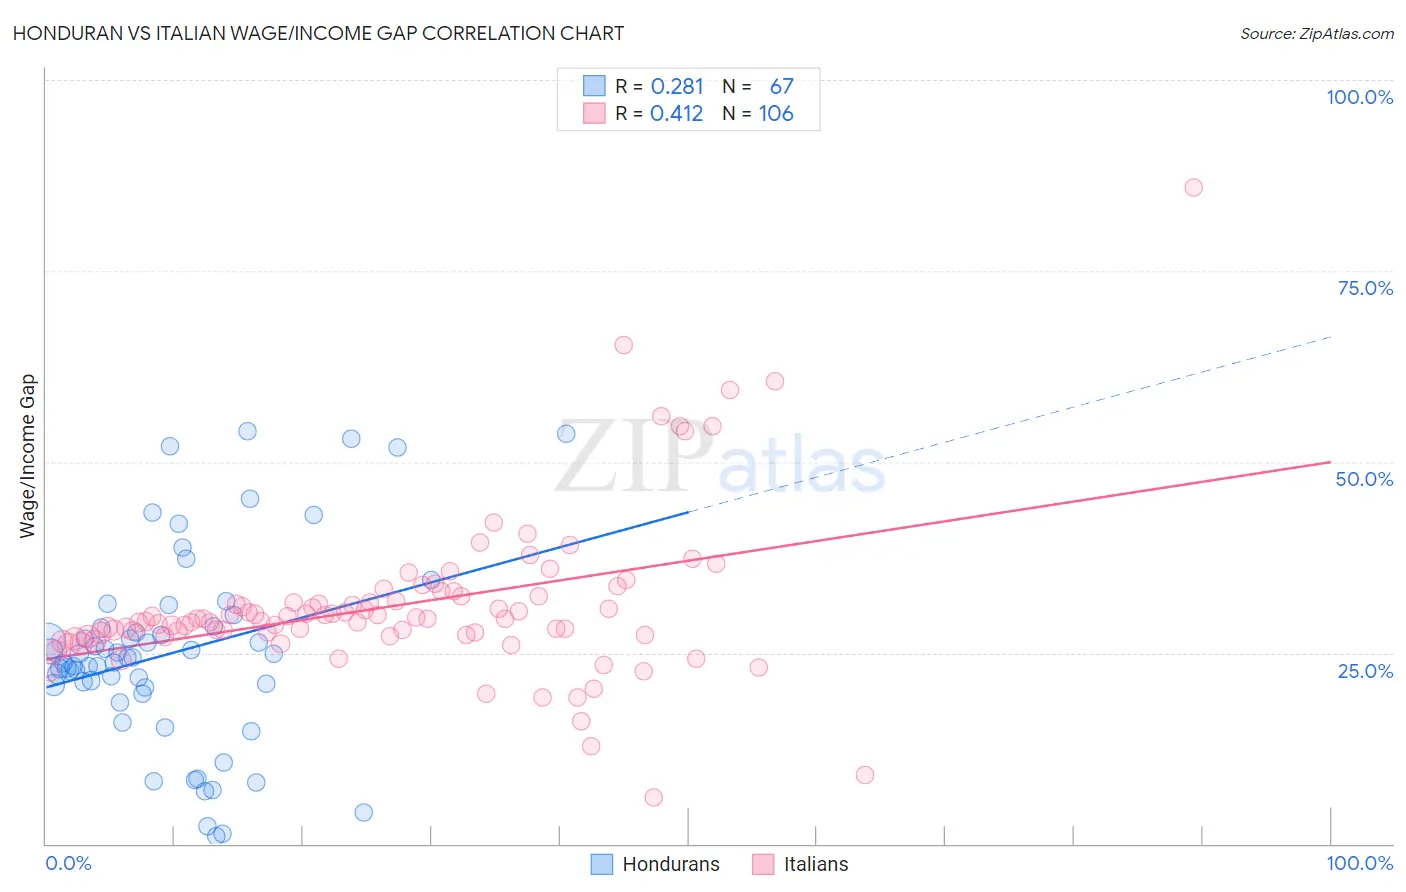
Honduran vs Italian Wage/Income Gap Correlation Chart
The statistical analysis conducted on geographies consisting of 357,631,744 people shows a weak positive correlation between the proportion of Hondurans and wage/income gap percentage in the United States with a correlation coefficient (R) of 0.281 and weighted average of 23.6%. Similarly, the statistical analysis conducted on geographies consisting of 571,985,194 people shows a moderate positive correlation between the proportion of Italians and wage/income gap percentage in the United States with a correlation coefficient (R) of 0.412 and weighted average of 28.1%, a difference of 19.2%.
Wage/Income Gap Correlation Summary
| Measurement | Honduran | Italian |
| Minimum | 0.90% | 6.1% |
| Maximum | 53.9% | 86.0% |
| Range | 53.0% | 79.9% |
| Mean | 25.0% | 31.2% |
| Median | 24.4% | 29.5% |
| Interquartile 25% (IQ1) | 20.4% | 27.3% |
| Interquartile 75% (IQ3) | 28.4% | 32.4% |
| Interquartile Range (IQR) | 8.0% | 5.1% |
| Standard Deviation (Sample) | 12.6% | 10.6% |
| Standard Deviation (Population) | 12.5% | 10.5% |
Similar Demographics by Wage/Income Gap
Demographics Similar to Hondurans by Wage/Income Gap
In terms of wage/income gap, the demographic groups most similar to Hondurans are Cape Verdean (23.6%, a difference of 0.030%), Immigrants from Cabo Verde (23.6%, a difference of 0.090%), Kiowa (23.6%, a difference of 0.15%), Immigrants from Sudan (23.6%, a difference of 0.24%), and Immigrants from Honduras (23.5%, a difference of 0.33%).
| Demographics | Rating | Rank | Wage/Income Gap |
| Yuman | 99.7 /100 | #87 | Exceptional 23.3% |
| Immigrants | Panama | 99.6 /100 | #88 | Exceptional 23.4% |
| Marshallese | 99.6 /100 | #89 | Exceptional 23.4% |
| Nicaraguans | 99.6 /100 | #90 | Exceptional 23.4% |
| Arapaho | 99.6 /100 | #91 | Exceptional 23.5% |
| Immigrants | Honduras | 99.5 /100 | #92 | Exceptional 23.5% |
| Immigrants | Cabo Verde | 99.5 /100 | #93 | Exceptional 23.6% |
| Hondurans | 99.5 /100 | #94 | Exceptional 23.6% |
| Cape Verdeans | 99.4 /100 | #95 | Exceptional 23.6% |
| Kiowa | 99.4 /100 | #96 | Exceptional 23.6% |
| Immigrants | Sudan | 99.4 /100 | #97 | Exceptional 23.6% |
| Immigrants | Latin America | 99.2 /100 | #98 | Exceptional 23.7% |
| Aleuts | 99.2 /100 | #99 | Exceptional 23.7% |
| Yakama | 99.2 /100 | #100 | Exceptional 23.7% |
| Japanese | 99.1 /100 | #101 | Exceptional 23.8% |
Demographics Similar to Italians by Wage/Income Gap
In terms of wage/income gap, the demographic groups most similar to Italians are Immigrants from Austria (28.1%, a difference of 0.030%), Okinawan (28.1%, a difference of 0.070%), Choctaw (28.1%, a difference of 0.10%), Immigrants from Sweden (28.1%, a difference of 0.13%), and French Canadian (28.1%, a difference of 0.14%).
| Demographics | Rating | Rank | Wage/Income Gap |
| Immigrants | England | 0.6 /100 | #278 | Tragic 27.9% |
| Romanians | 0.5 /100 | #279 | Tragic 28.0% |
| Russians | 0.5 /100 | #280 | Tragic 28.0% |
| Burmese | 0.5 /100 | #281 | Tragic 28.0% |
| South Africans | 0.5 /100 | #282 | Tragic 28.0% |
| French Canadians | 0.4 /100 | #283 | Tragic 28.1% |
| Immigrants | Sweden | 0.4 /100 | #284 | Tragic 28.1% |
| Italians | 0.4 /100 | #285 | Tragic 28.1% |
| Immigrants | Austria | 0.4 /100 | #286 | Tragic 28.1% |
| Okinawans | 0.4 /100 | #287 | Tragic 28.1% |
| Choctaw | 0.4 /100 | #288 | Tragic 28.1% |
| Canadians | 0.3 /100 | #289 | Tragic 28.1% |
| Australians | 0.3 /100 | #290 | Tragic 28.2% |
| Czechoslovakians | 0.3 /100 | #291 | Tragic 28.2% |
| Immigrants | Australia | 0.3 /100 | #292 | Tragic 28.2% |