Honduran vs Icelander Wage/Income Gap
COMPARE
Honduran
Icelander
Wage/Income Gap
Wage/Income Gap Comparison
Hondurans
Icelanders
23.6%
WAGE/INCOME GAP
99.5/ 100
METRIC RATING
94th/ 347
METRIC RANK
27.5%
WAGE/INCOME GAP
1.8/ 100
METRIC RATING
259th/ 347
METRIC RANK
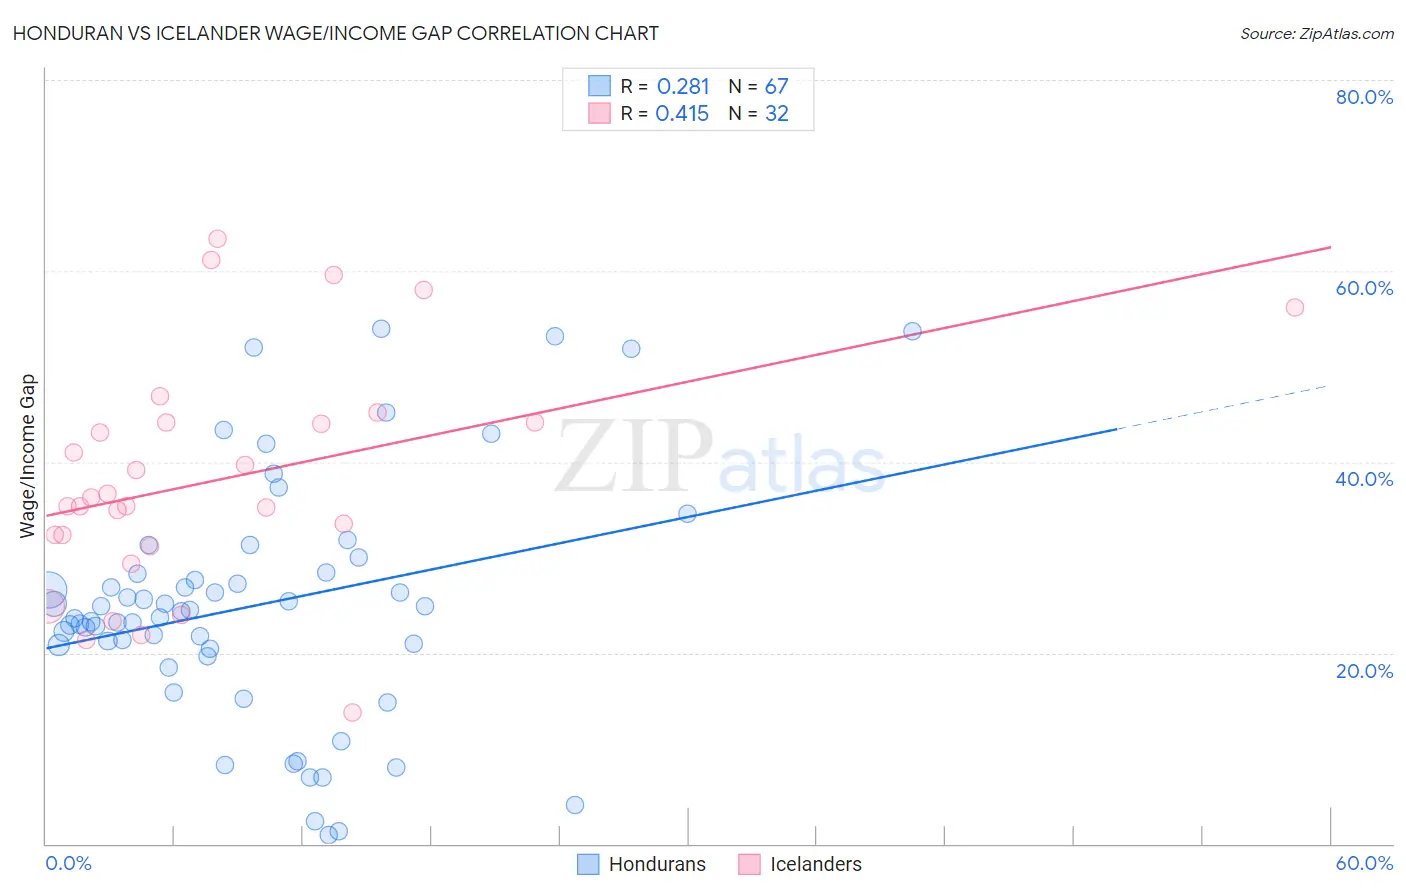
Honduran vs Icelander Wage/Income Gap Correlation Chart
The statistical analysis conducted on geographies consisting of 357,631,744 people shows a weak positive correlation between the proportion of Hondurans and wage/income gap percentage in the United States with a correlation coefficient (R) of 0.281 and weighted average of 23.6%. Similarly, the statistical analysis conducted on geographies consisting of 159,627,714 people shows a moderate positive correlation between the proportion of Icelanders and wage/income gap percentage in the United States with a correlation coefficient (R) of 0.415 and weighted average of 27.5%, a difference of 16.5%.
Wage/Income Gap Correlation Summary
| Measurement | Honduran | Icelander |
| Minimum | 0.90% | 13.8% |
| Maximum | 53.9% | 63.4% |
| Range | 53.0% | 49.6% |
| Mean | 25.0% | 38.2% |
| Median | 24.4% | 35.8% |
| Interquartile 25% (IQ1) | 20.4% | 31.7% |
| Interquartile 75% (IQ3) | 28.4% | 44.1% |
| Interquartile Range (IQR) | 8.0% | 12.4% |
| Standard Deviation (Sample) | 12.6% | 12.2% |
| Standard Deviation (Population) | 12.5% | 12.0% |
Similar Demographics by Wage/Income Gap
Demographics Similar to Hondurans by Wage/Income Gap
In terms of wage/income gap, the demographic groups most similar to Hondurans are Cape Verdean (23.6%, a difference of 0.030%), Immigrants from Cabo Verde (23.6%, a difference of 0.090%), Kiowa (23.6%, a difference of 0.15%), Immigrants from Sudan (23.6%, a difference of 0.24%), and Immigrants from Honduras (23.5%, a difference of 0.33%).
| Demographics | Rating | Rank | Wage/Income Gap |
| Yuman | 99.7 /100 | #87 | Exceptional 23.3% |
| Immigrants | Panama | 99.6 /100 | #88 | Exceptional 23.4% |
| Marshallese | 99.6 /100 | #89 | Exceptional 23.4% |
| Nicaraguans | 99.6 /100 | #90 | Exceptional 23.4% |
| Arapaho | 99.6 /100 | #91 | Exceptional 23.5% |
| Immigrants | Honduras | 99.5 /100 | #92 | Exceptional 23.5% |
| Immigrants | Cabo Verde | 99.5 /100 | #93 | Exceptional 23.6% |
| Hondurans | 99.5 /100 | #94 | Exceptional 23.6% |
| Cape Verdeans | 99.4 /100 | #95 | Exceptional 23.6% |
| Kiowa | 99.4 /100 | #96 | Exceptional 23.6% |
| Immigrants | Sudan | 99.4 /100 | #97 | Exceptional 23.6% |
| Immigrants | Latin America | 99.2 /100 | #98 | Exceptional 23.7% |
| Aleuts | 99.2 /100 | #99 | Exceptional 23.7% |
| Yakama | 99.2 /100 | #100 | Exceptional 23.7% |
| Japanese | 99.1 /100 | #101 | Exceptional 23.8% |
Demographics Similar to Icelanders by Wage/Income Gap
In terms of wage/income gap, the demographic groups most similar to Icelanders are Tongan (27.5%, a difference of 0.020%), Slavic (27.4%, a difference of 0.080%), Luxembourger (27.4%, a difference of 0.11%), Cherokee (27.4%, a difference of 0.16%), and Israeli (27.4%, a difference of 0.27%).
| Demographics | Rating | Rank | Wage/Income Gap |
| Ukrainians | 2.4 /100 | #252 | Tragic 27.3% |
| Portuguese | 2.2 /100 | #253 | Tragic 27.4% |
| Israelis | 2.1 /100 | #254 | Tragic 27.4% |
| Immigrants | France | 2.1 /100 | #255 | Tragic 27.4% |
| Cherokee | 1.9 /100 | #256 | Tragic 27.4% |
| Luxembourgers | 1.9 /100 | #257 | Tragic 27.4% |
| Slavs | 1.8 /100 | #258 | Tragic 27.4% |
| Icelanders | 1.8 /100 | #259 | Tragic 27.5% |
| Tongans | 1.7 /100 | #260 | Tragic 27.5% |
| Immigrants | Germany | 1.5 /100 | #261 | Tragic 27.5% |
| Immigrants | Lebanon | 1.5 /100 | #262 | Tragic 27.5% |
| Syrians | 1.4 /100 | #263 | Tragic 27.6% |
| Immigrants | Switzerland | 1.0 /100 | #264 | Tragic 27.7% |
| Serbians | 1.0 /100 | #265 | Tragic 27.7% |
| Hmong | 1.0 /100 | #266 | Tragic 27.7% |