Immigrants from Scotland vs Icelander Wage/Income Gap
COMPARE
Immigrants from Scotland
Icelander
Wage/Income Gap
Wage/Income Gap Comparison
Immigrants from Scotland
Icelanders
28.7%
WAGE/INCOME GAP
0.1/ 100
METRIC RATING
314th/ 347
METRIC RANK
27.5%
WAGE/INCOME GAP
1.8/ 100
METRIC RATING
259th/ 347
METRIC RANK
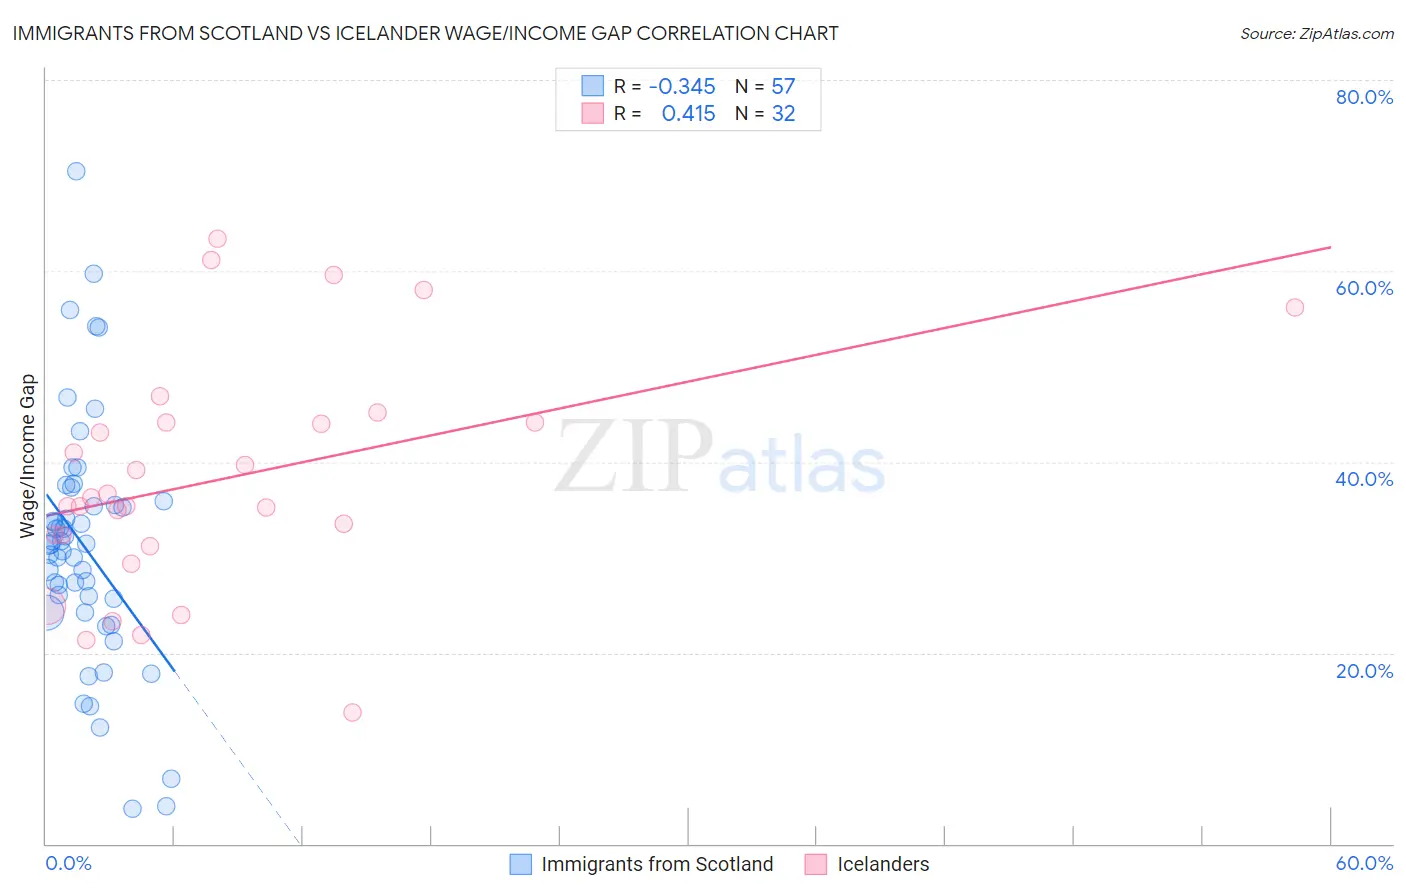
Immigrants from Scotland vs Icelander Wage/Income Gap Correlation Chart
The statistical analysis conducted on geographies consisting of 196,317,574 people shows a mild negative correlation between the proportion of Immigrants from Scotland and wage/income gap percentage in the United States with a correlation coefficient (R) of -0.345 and weighted average of 28.7%. Similarly, the statistical analysis conducted on geographies consisting of 159,627,714 people shows a moderate positive correlation between the proportion of Icelanders and wage/income gap percentage in the United States with a correlation coefficient (R) of 0.415 and weighted average of 27.5%, a difference of 4.6%.
Wage/Income Gap Correlation Summary
| Measurement | Immigrants from Scotland | Icelander |
| Minimum | 3.7% | 13.8% |
| Maximum | 70.5% | 63.4% |
| Range | 66.8% | 49.6% |
| Mean | 31.2% | 38.2% |
| Median | 31.4% | 35.8% |
| Interquartile 25% (IQ1) | 24.9% | 31.7% |
| Interquartile 75% (IQ3) | 35.7% | 44.1% |
| Interquartile Range (IQR) | 10.7% | 12.4% |
| Standard Deviation (Sample) | 12.7% | 12.2% |
| Standard Deviation (Population) | 12.6% | 12.0% |
Similar Demographics by Wage/Income Gap
Demographics Similar to Immigrants from Scotland by Wage/Income Gap
In terms of wage/income gap, the demographic groups most similar to Immigrants from Scotland are Maltese (28.7%, a difference of 0.050%), Lithuanian (28.7%, a difference of 0.060%), French (28.7%, a difference of 0.15%), Belgian (28.8%, a difference of 0.17%), and Basque (28.8%, a difference of 0.22%).
| Demographics | Rating | Rank | Wage/Income Gap |
| Immigrants | Denmark | 0.1 /100 | #307 | Tragic 28.5% |
| Poles | 0.1 /100 | #308 | Tragic 28.5% |
| Macedonians | 0.1 /100 | #309 | Tragic 28.6% |
| Finns | 0.1 /100 | #310 | Tragic 28.6% |
| Immigrants | Lithuania | 0.1 /100 | #311 | Tragic 28.6% |
| Eastern Europeans | 0.1 /100 | #312 | Tragic 28.6% |
| French | 0.1 /100 | #313 | Tragic 28.7% |
| Immigrants | Scotland | 0.1 /100 | #314 | Tragic 28.7% |
| Maltese | 0.1 /100 | #315 | Tragic 28.7% |
| Lithuanians | 0.1 /100 | #316 | Tragic 28.7% |
| Belgians | 0.1 /100 | #317 | Tragic 28.8% |
| Basques | 0.1 /100 | #318 | Tragic 28.8% |
| Slovaks | 0.1 /100 | #319 | Tragic 28.9% |
| British | 0.1 /100 | #320 | Tragic 28.9% |
| Welsh | 0.1 /100 | #321 | Tragic 28.9% |
Demographics Similar to Icelanders by Wage/Income Gap
In terms of wage/income gap, the demographic groups most similar to Icelanders are Tongan (27.5%, a difference of 0.020%), Slavic (27.4%, a difference of 0.080%), Luxembourger (27.4%, a difference of 0.11%), Cherokee (27.4%, a difference of 0.16%), and Israeli (27.4%, a difference of 0.27%).
| Demographics | Rating | Rank | Wage/Income Gap |
| Ukrainians | 2.4 /100 | #252 | Tragic 27.3% |
| Portuguese | 2.2 /100 | #253 | Tragic 27.4% |
| Israelis | 2.1 /100 | #254 | Tragic 27.4% |
| Immigrants | France | 2.1 /100 | #255 | Tragic 27.4% |
| Cherokee | 1.9 /100 | #256 | Tragic 27.4% |
| Luxembourgers | 1.9 /100 | #257 | Tragic 27.4% |
| Slavs | 1.8 /100 | #258 | Tragic 27.4% |
| Icelanders | 1.8 /100 | #259 | Tragic 27.5% |
| Tongans | 1.7 /100 | #260 | Tragic 27.5% |
| Immigrants | Germany | 1.5 /100 | #261 | Tragic 27.5% |
| Immigrants | Lebanon | 1.5 /100 | #262 | Tragic 27.5% |
| Syrians | 1.4 /100 | #263 | Tragic 27.6% |
| Immigrants | Switzerland | 1.0 /100 | #264 | Tragic 27.7% |
| Serbians | 1.0 /100 | #265 | Tragic 27.7% |
| Hmong | 1.0 /100 | #266 | Tragic 27.7% |