Romanian vs Icelander Wage/Income Gap
COMPARE
Romanian
Icelander
Wage/Income Gap
Wage/Income Gap Comparison
Romanians
Icelanders
28.0%
WAGE/INCOME GAP
0.5/ 100
METRIC RATING
279th/ 347
METRIC RANK
27.5%
WAGE/INCOME GAP
1.8/ 100
METRIC RATING
259th/ 347
METRIC RANK
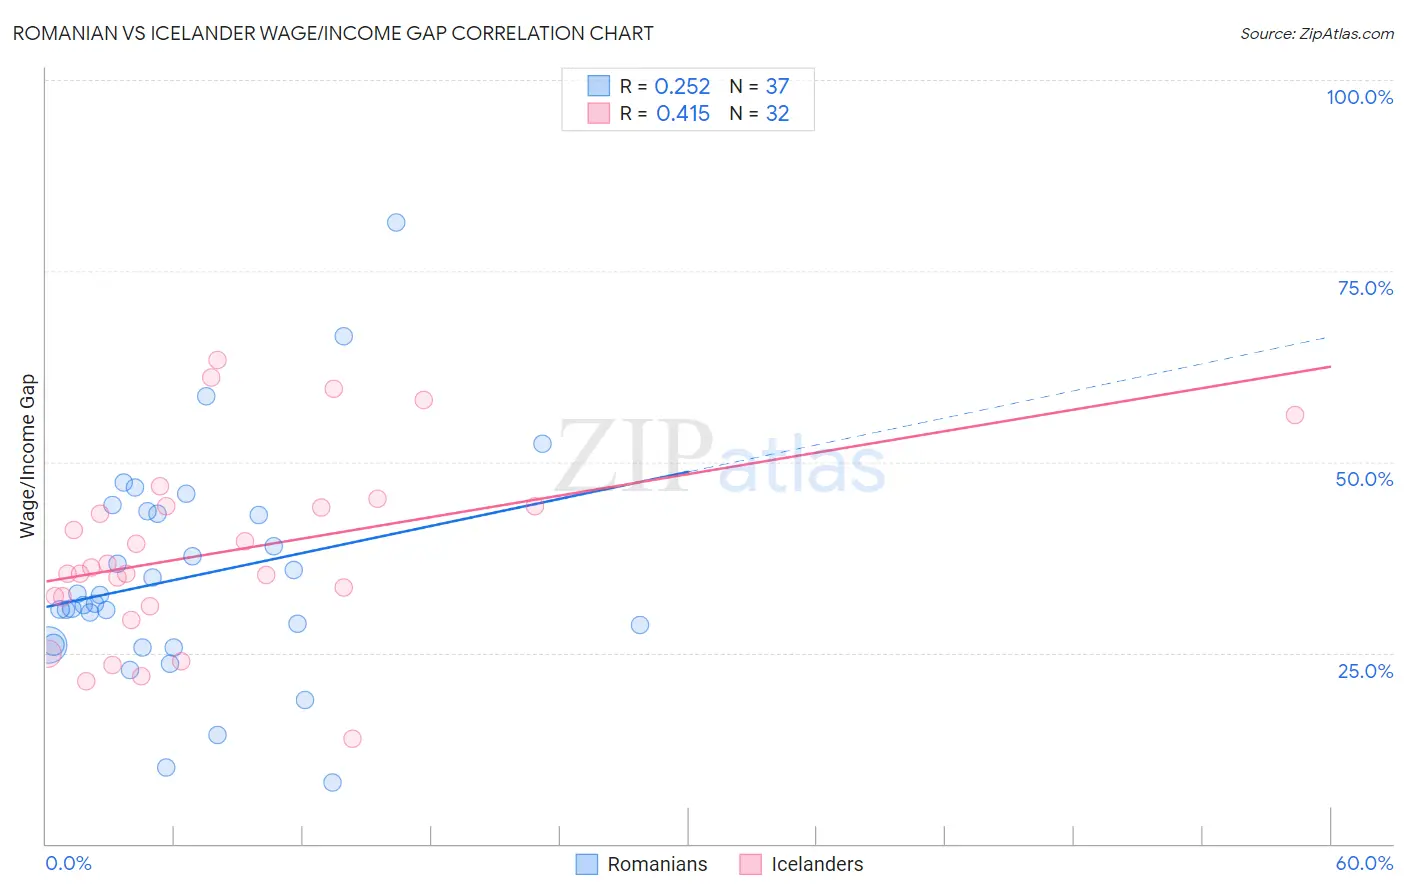
Romanian vs Icelander Wage/Income Gap Correlation Chart
The statistical analysis conducted on geographies consisting of 377,662,132 people shows a weak positive correlation between the proportion of Romanians and wage/income gap percentage in the United States with a correlation coefficient (R) of 0.252 and weighted average of 28.0%. Similarly, the statistical analysis conducted on geographies consisting of 159,627,714 people shows a moderate positive correlation between the proportion of Icelanders and wage/income gap percentage in the United States with a correlation coefficient (R) of 0.415 and weighted average of 27.5%, a difference of 1.8%.
Wage/Income Gap Correlation Summary
| Measurement | Romanian | Icelander |
| Minimum | 8.0% | 13.8% |
| Maximum | 81.4% | 63.4% |
| Range | 73.3% | 49.6% |
| Mean | 35.0% | 38.2% |
| Median | 31.4% | 35.8% |
| Interquartile 25% (IQ1) | 26.0% | 31.7% |
| Interquartile 75% (IQ3) | 43.4% | 44.1% |
| Interquartile Range (IQR) | 17.3% | 12.4% |
| Standard Deviation (Sample) | 14.5% | 12.2% |
| Standard Deviation (Population) | 14.3% | 12.0% |
Demographics Similar to Romanians and Icelanders by Wage/Income Gap
In terms of wage/income gap, the demographic groups most similar to Romanians are Immigrants from England (27.9%, a difference of 0.23%), Lebanese (27.9%, a difference of 0.31%), Latvian (27.9%, a difference of 0.31%), Immigrants from Japan (27.9%, a difference of 0.34%), and American (27.8%, a difference of 0.43%). Similarly, the demographic groups most similar to Icelanders are Tongan (27.5%, a difference of 0.020%), Immigrants from Germany (27.5%, a difference of 0.28%), Immigrants from Lebanon (27.5%, a difference of 0.29%), Syrian (27.6%, a difference of 0.38%), and Immigrants from Switzerland (27.7%, a difference of 0.84%).
| Demographics | Rating | Rank | Wage/Income Gap |
| Icelanders | 1.8 /100 | #259 | Tragic 27.5% |
| Tongans | 1.7 /100 | #260 | Tragic 27.5% |
| Immigrants | Germany | 1.5 /100 | #261 | Tragic 27.5% |
| Immigrants | Lebanon | 1.5 /100 | #262 | Tragic 27.5% |
| Syrians | 1.4 /100 | #263 | Tragic 27.6% |
| Immigrants | Switzerland | 1.0 /100 | #264 | Tragic 27.7% |
| Serbians | 1.0 /100 | #265 | Tragic 27.7% |
| Hmong | 1.0 /100 | #266 | Tragic 27.7% |
| Turks | 1.0 /100 | #267 | Tragic 27.7% |
| New Zealanders | 1.0 /100 | #268 | Tragic 27.7% |
| Potawatomi | 0.9 /100 | #269 | Tragic 27.7% |
| Immigrants | Western Europe | 0.9 /100 | #270 | Tragic 27.8% |
| Ute | 0.8 /100 | #271 | Tragic 27.8% |
| Immigrants | Korea | 0.8 /100 | #272 | Tragic 27.8% |
| Bulgarians | 0.7 /100 | #273 | Tragic 27.8% |
| Americans | 0.7 /100 | #274 | Tragic 27.8% |
| Immigrants | Japan | 0.7 /100 | #275 | Tragic 27.9% |
| Lebanese | 0.7 /100 | #276 | Tragic 27.9% |
| Latvians | 0.7 /100 | #277 | Tragic 27.9% |
| Immigrants | England | 0.6 /100 | #278 | Tragic 27.9% |
| Romanians | 0.5 /100 | #279 | Tragic 28.0% |