Hispanic or Latino vs Immigrants from Congo Median Earnings
COMPARE
Hispanic or Latino
Immigrants from Congo
Median Earnings
Median Earnings Comparison
Hispanics or Latinos
Immigrants from Congo
$40,288
MEDIAN EARNINGS
0.0/ 100
METRIC RATING
311th/ 347
METRIC RANK
$39,169
MEDIAN EARNINGS
0.0/ 100
METRIC RATING
330th/ 347
METRIC RANK
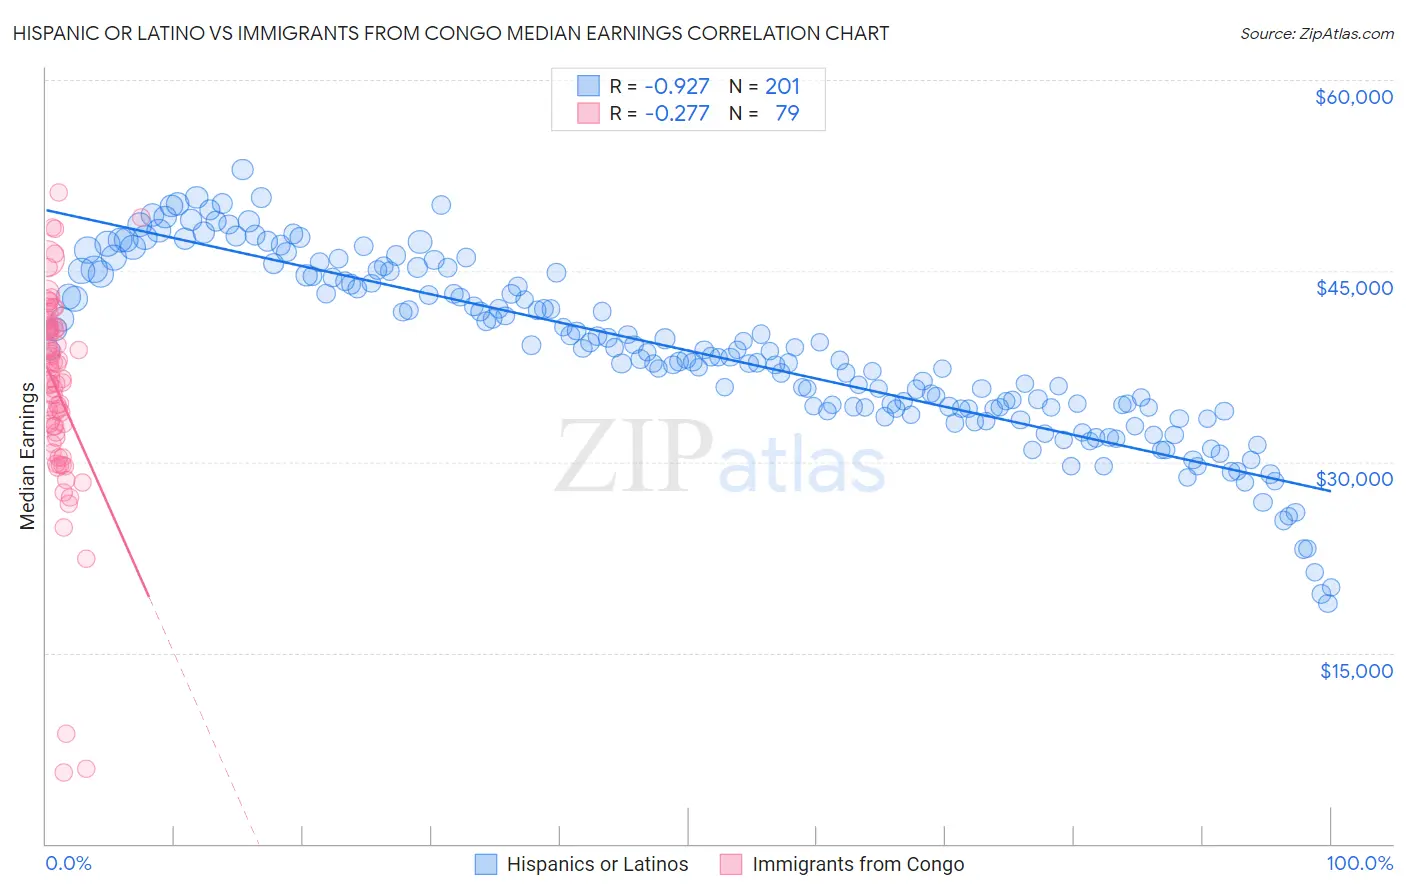
Hispanic or Latino vs Immigrants from Congo Median Earnings Correlation Chart
The statistical analysis conducted on geographies consisting of 578,075,815 people shows a near-perfect negative correlation between the proportion of Hispanics or Latinos and median earnings in the United States with a correlation coefficient (R) of -0.927 and weighted average of $40,288. Similarly, the statistical analysis conducted on geographies consisting of 92,120,169 people shows a weak negative correlation between the proportion of Immigrants from Congo and median earnings in the United States with a correlation coefficient (R) of -0.277 and weighted average of $39,169, a difference of 2.9%.
Median Earnings Correlation Summary
| Measurement | Hispanic or Latino | Immigrants from Congo |
| Minimum | $18,851 | $5,625 |
| Maximum | $52,967 | $51,158 |
| Range | $34,116 | $45,533 |
| Mean | $38,684 | $35,599 |
| Median | $38,266 | $36,543 |
| Interquartile 25% (IQ1) | $34,210 | $31,963 |
| Interquartile 75% (IQ3) | $44,630 | $40,520 |
| Interquartile Range (IQR) | $10,420 | $8,557 |
| Standard Deviation (Sample) | $6,924 | $8,202 |
| Standard Deviation (Population) | $6,907 | $8,150 |
Demographics Similar to Hispanics or Latinos and Immigrants from Congo by Median Earnings
In terms of median earnings, the demographic groups most similar to Hispanics or Latinos are Chippewa ($40,287, a difference of 0.0%), Choctaw ($40,270, a difference of 0.040%), Cheyenne ($40,233, a difference of 0.14%), Seminole ($40,233, a difference of 0.14%), and Immigrants from Honduras ($40,195, a difference of 0.23%). Similarly, the demographic groups most similar to Immigrants from Congo are Kiowa ($39,232, a difference of 0.16%), Sioux ($39,448, a difference of 0.71%), Yuman ($39,523, a difference of 0.90%), Immigrants from Yemen ($39,540, a difference of 0.95%), and Creek ($39,648, a difference of 1.2%).
| Demographics | Rating | Rank | Median Earnings |
| Apache | 0.0 /100 | #310 | Tragic $40,388 |
| Hispanics or Latinos | 0.0 /100 | #311 | Tragic $40,288 |
| Chippewa | 0.0 /100 | #312 | Tragic $40,287 |
| Choctaw | 0.0 /100 | #313 | Tragic $40,270 |
| Cheyenne | 0.0 /100 | #314 | Tragic $40,233 |
| Seminole | 0.0 /100 | #315 | Tragic $40,233 |
| Immigrants | Honduras | 0.0 /100 | #316 | Tragic $40,195 |
| Fijians | 0.0 /100 | #317 | Tragic $40,193 |
| Dutch West Indians | 0.0 /100 | #318 | Tragic $40,107 |
| Blacks/African Americans | 0.0 /100 | #319 | Tragic $40,085 |
| Immigrants | Bahamas | 0.0 /100 | #320 | Tragic $39,861 |
| Mexicans | 0.0 /100 | #321 | Tragic $39,834 |
| Immigrants | Central America | 0.0 /100 | #322 | Tragic $39,762 |
| Bahamians | 0.0 /100 | #323 | Tragic $39,735 |
| Ottawa | 0.0 /100 | #324 | Tragic $39,721 |
| Creek | 0.0 /100 | #325 | Tragic $39,648 |
| Immigrants | Yemen | 0.0 /100 | #326 | Tragic $39,540 |
| Yuman | 0.0 /100 | #327 | Tragic $39,523 |
| Sioux | 0.0 /100 | #328 | Tragic $39,448 |
| Kiowa | 0.0 /100 | #329 | Tragic $39,232 |
| Immigrants | Congo | 0.0 /100 | #330 | Tragic $39,169 |