Central American vs Immigrants from Congo Median Earnings
COMPARE
Central American
Immigrants from Congo
Median Earnings
Median Earnings Comparison
Central Americans
Immigrants from Congo
$42,280
MEDIAN EARNINGS
0.3/ 100
METRIC RATING
277th/ 347
METRIC RANK
$39,169
MEDIAN EARNINGS
0.0/ 100
METRIC RATING
330th/ 347
METRIC RANK
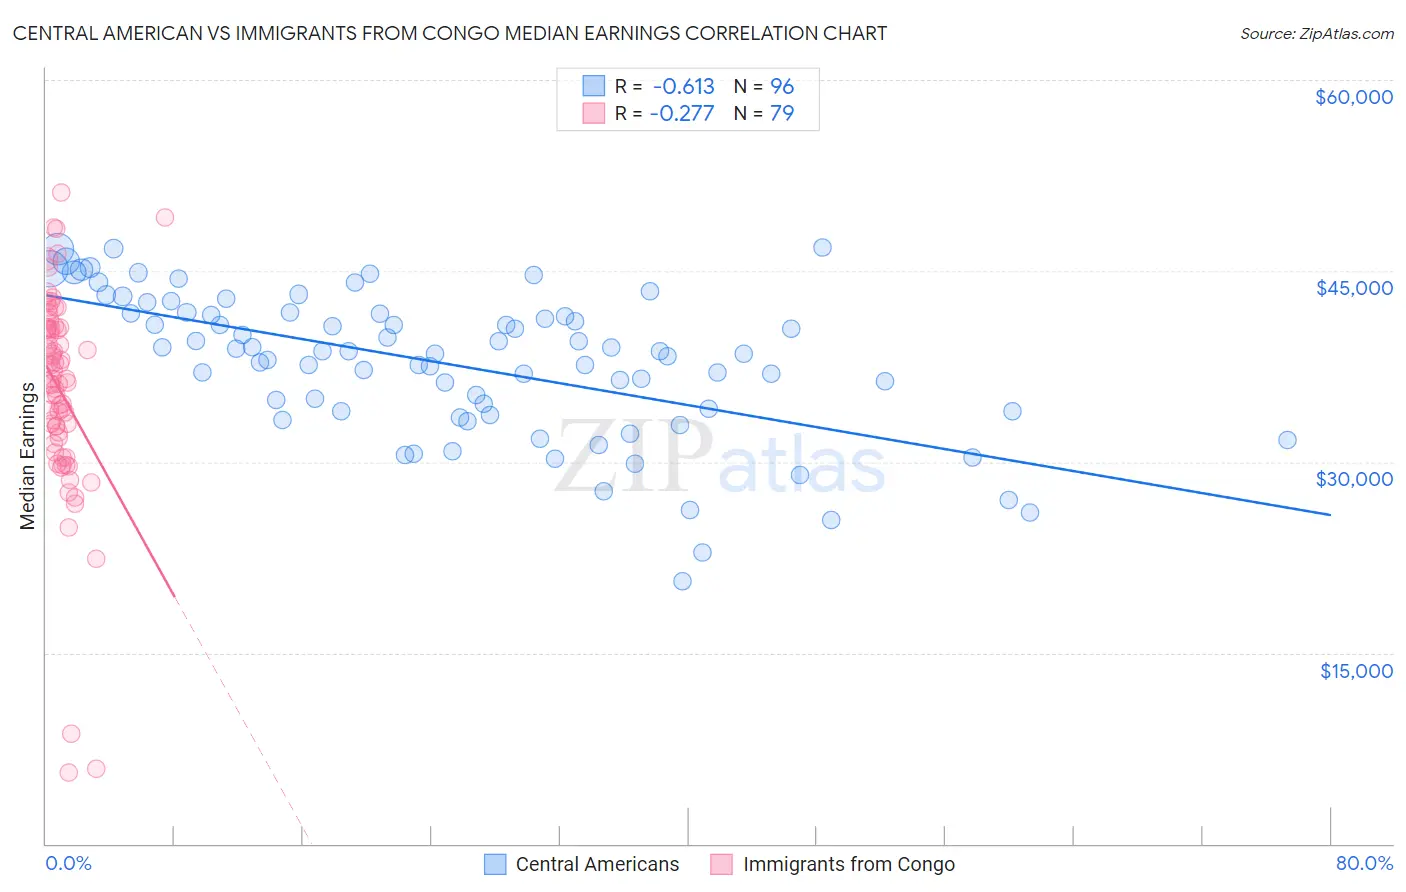
Central American vs Immigrants from Congo Median Earnings Correlation Chart
The statistical analysis conducted on geographies consisting of 504,567,370 people shows a significant negative correlation between the proportion of Central Americans and median earnings in the United States with a correlation coefficient (R) of -0.613 and weighted average of $42,280. Similarly, the statistical analysis conducted on geographies consisting of 92,120,169 people shows a weak negative correlation between the proportion of Immigrants from Congo and median earnings in the United States with a correlation coefficient (R) of -0.277 and weighted average of $39,169, a difference of 7.9%.
Median Earnings Correlation Summary
| Measurement | Central American | Immigrants from Congo |
| Minimum | $20,583 | $5,625 |
| Maximum | $46,875 | $51,158 |
| Range | $26,292 | $45,533 |
| Mean | $37,665 | $35,599 |
| Median | $38,592 | $36,543 |
| Interquartile 25% (IQ1) | $34,004 | $31,963 |
| Interquartile 75% (IQ3) | $41,685 | $40,520 |
| Interquartile Range (IQR) | $7,681 | $8,557 |
| Standard Deviation (Sample) | $5,685 | $8,202 |
| Standard Deviation (Population) | $5,655 | $8,150 |
Similar Demographics by Median Earnings
Demographics Similar to Central Americans by Median Earnings
In terms of median earnings, the demographic groups most similar to Central Americans are Spanish American ($42,316, a difference of 0.090%), Immigrants from Belize ($42,339, a difference of 0.14%), Cajun ($42,189, a difference of 0.21%), Colville ($42,151, a difference of 0.31%), and Immigrants from El Salvador ($42,413, a difference of 0.32%).
| Demographics | Rating | Rank | Median Earnings |
| Osage | 0.5 /100 | #270 | Tragic $42,651 |
| Pennsylvania Germans | 0.5 /100 | #271 | Tragic $42,615 |
| Iroquois | 0.4 /100 | #272 | Tragic $42,430 |
| Immigrants | Dominica | 0.4 /100 | #273 | Tragic $42,420 |
| Immigrants | El Salvador | 0.4 /100 | #274 | Tragic $42,413 |
| Immigrants | Belize | 0.3 /100 | #275 | Tragic $42,339 |
| Spanish Americans | 0.3 /100 | #276 | Tragic $42,316 |
| Central Americans | 0.3 /100 | #277 | Tragic $42,280 |
| Cajuns | 0.3 /100 | #278 | Tragic $42,189 |
| Colville | 0.2 /100 | #279 | Tragic $42,151 |
| Hmong | 0.2 /100 | #280 | Tragic $42,111 |
| Marshallese | 0.2 /100 | #281 | Tragic $41,969 |
| Africans | 0.2 /100 | #282 | Tragic $41,955 |
| Dominicans | 0.2 /100 | #283 | Tragic $41,864 |
| Blackfeet | 0.2 /100 | #284 | Tragic $41,822 |
Demographics Similar to Immigrants from Congo by Median Earnings
In terms of median earnings, the demographic groups most similar to Immigrants from Congo are Immigrants from Mexico ($39,114, a difference of 0.14%), Kiowa ($39,232, a difference of 0.16%), Yakama ($39,107, a difference of 0.16%), Houma ($38,949, a difference of 0.57%), and Spanish American Indian ($38,907, a difference of 0.67%).
| Demographics | Rating | Rank | Median Earnings |
| Bahamians | 0.0 /100 | #323 | Tragic $39,735 |
| Ottawa | 0.0 /100 | #324 | Tragic $39,721 |
| Creek | 0.0 /100 | #325 | Tragic $39,648 |
| Immigrants | Yemen | 0.0 /100 | #326 | Tragic $39,540 |
| Yuman | 0.0 /100 | #327 | Tragic $39,523 |
| Sioux | 0.0 /100 | #328 | Tragic $39,448 |
| Kiowa | 0.0 /100 | #329 | Tragic $39,232 |
| Immigrants | Congo | 0.0 /100 | #330 | Tragic $39,169 |
| Immigrants | Mexico | 0.0 /100 | #331 | Tragic $39,114 |
| Yakama | 0.0 /100 | #332 | Tragic $39,107 |
| Houma | 0.0 /100 | #333 | Tragic $38,949 |
| Spanish American Indians | 0.0 /100 | #334 | Tragic $38,907 |
| Natives/Alaskans | 0.0 /100 | #335 | Tragic $38,896 |
| Crow | 0.0 /100 | #336 | Tragic $38,707 |
| Immigrants | Cuba | 0.0 /100 | #337 | Tragic $38,426 |