Hispanic or Latino vs Asian Median Earnings
COMPARE
Hispanic or Latino
Asian
Median Earnings
Median Earnings Comparison
Hispanics or Latinos
Asians
$40,288
MEDIAN EARNINGS
0.0/ 100
METRIC RATING
311th/ 347
METRIC RANK
$53,690
MEDIAN EARNINGS
100.0/ 100
METRIC RATING
27th/ 347
METRIC RANK
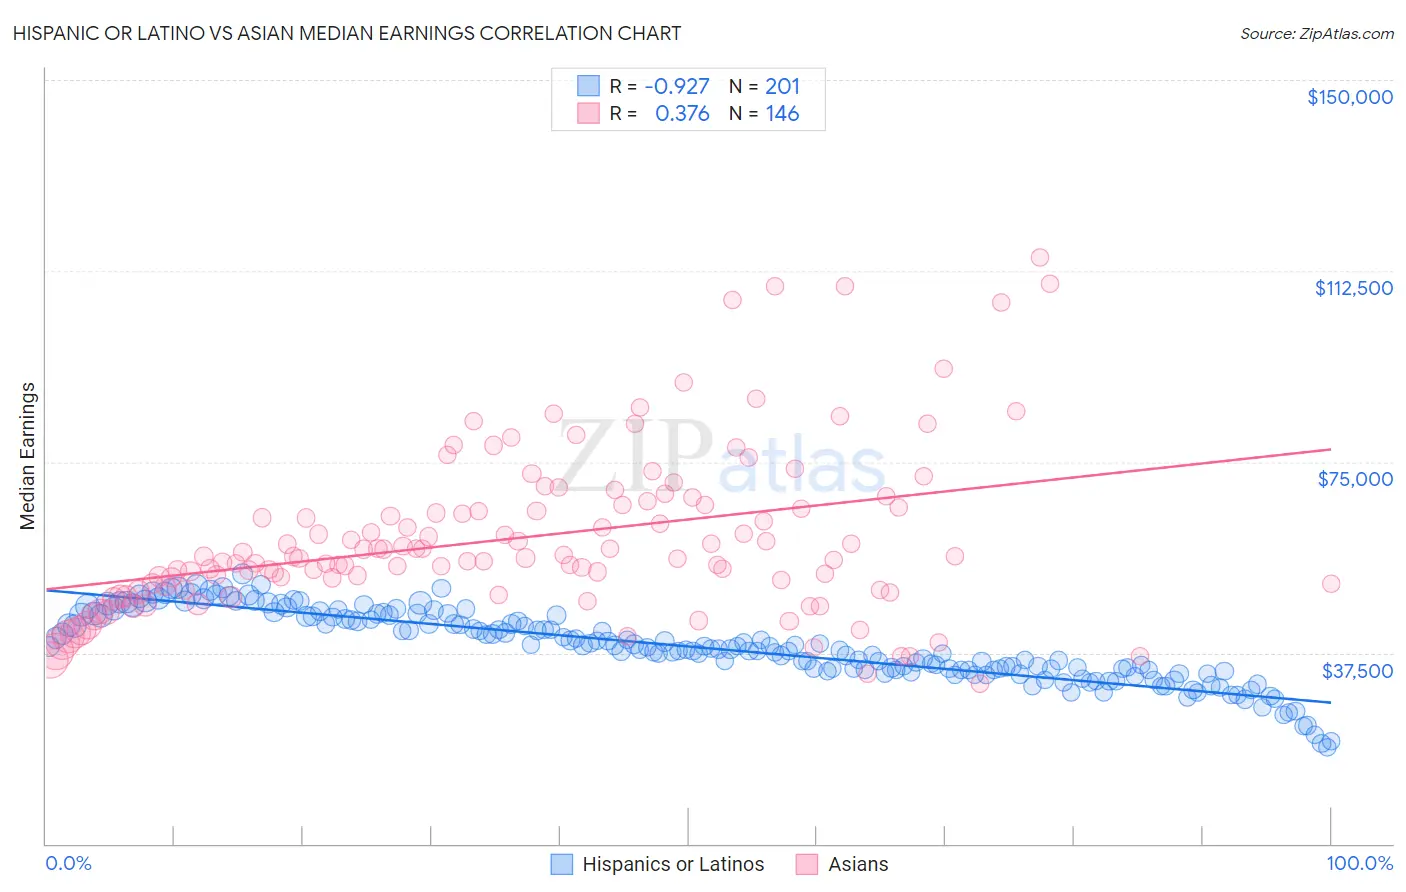
Hispanic or Latino vs Asian Median Earnings Correlation Chart
The statistical analysis conducted on geographies consisting of 578,075,815 people shows a near-perfect negative correlation between the proportion of Hispanics or Latinos and median earnings in the United States with a correlation coefficient (R) of -0.927 and weighted average of $40,288. Similarly, the statistical analysis conducted on geographies consisting of 550,727,448 people shows a mild positive correlation between the proportion of Asians and median earnings in the United States with a correlation coefficient (R) of 0.376 and weighted average of $53,690, a difference of 33.3%.
Median Earnings Correlation Summary
| Measurement | Hispanic or Latino | Asian |
| Minimum | $18,851 | $31,416 |
| Maximum | $52,967 | $115,028 |
| Range | $34,116 | $83,612 |
| Mean | $38,684 | $60,136 |
| Median | $38,266 | $56,241 |
| Interquartile 25% (IQ1) | $34,210 | $50,602 |
| Interquartile 75% (IQ3) | $44,630 | $66,425 |
| Interquartile Range (IQR) | $10,420 | $15,823 |
| Standard Deviation (Sample) | $6,924 | $16,173 |
| Standard Deviation (Population) | $6,907 | $16,117 |
Similar Demographics by Median Earnings
Demographics Similar to Hispanics or Latinos by Median Earnings
In terms of median earnings, the demographic groups most similar to Hispanics or Latinos are Chippewa ($40,287, a difference of 0.0%), Choctaw ($40,270, a difference of 0.040%), Cheyenne ($40,233, a difference of 0.14%), Seminole ($40,233, a difference of 0.14%), and Immigrants from Honduras ($40,195, a difference of 0.23%).
| Demographics | Rating | Rank | Median Earnings |
| Immigrants | Guatemala | 0.0 /100 | #304 | Tragic $40,851 |
| Chickasaw | 0.0 /100 | #305 | Tragic $40,672 |
| Yaqui | 0.0 /100 | #306 | Tragic $40,647 |
| Hondurans | 0.0 /100 | #307 | Tragic $40,638 |
| Cubans | 0.0 /100 | #308 | Tragic $40,619 |
| Immigrants | Haiti | 0.0 /100 | #309 | Tragic $40,550 |
| Apache | 0.0 /100 | #310 | Tragic $40,388 |
| Hispanics or Latinos | 0.0 /100 | #311 | Tragic $40,288 |
| Chippewa | 0.0 /100 | #312 | Tragic $40,287 |
| Choctaw | 0.0 /100 | #313 | Tragic $40,270 |
| Cheyenne | 0.0 /100 | #314 | Tragic $40,233 |
| Seminole | 0.0 /100 | #315 | Tragic $40,233 |
| Immigrants | Honduras | 0.0 /100 | #316 | Tragic $40,195 |
| Fijians | 0.0 /100 | #317 | Tragic $40,193 |
| Dutch West Indians | 0.0 /100 | #318 | Tragic $40,107 |
Demographics Similar to Asians by Median Earnings
In terms of median earnings, the demographic groups most similar to Asians are Immigrants from Northern Europe ($53,872, a difference of 0.34%), Immigrants from France ($53,490, a difference of 0.37%), Turkish ($53,919, a difference of 0.43%), Immigrants from Russia ($53,457, a difference of 0.43%), and Cambodian ($53,386, a difference of 0.57%).
| Demographics | Rating | Rank | Median Earnings |
| Cypriots | 100.0 /100 | #20 | Exceptional $54,589 |
| Burmese | 100.0 /100 | #21 | Exceptional $54,559 |
| Immigrants | Korea | 100.0 /100 | #22 | Exceptional $54,530 |
| Immigrants | Sweden | 100.0 /100 | #23 | Exceptional $54,478 |
| Soviet Union | 100.0 /100 | #24 | Exceptional $54,290 |
| Turks | 100.0 /100 | #25 | Exceptional $53,919 |
| Immigrants | Northern Europe | 100.0 /100 | #26 | Exceptional $53,872 |
| Asians | 100.0 /100 | #27 | Exceptional $53,690 |
| Immigrants | France | 100.0 /100 | #28 | Exceptional $53,490 |
| Immigrants | Russia | 100.0 /100 | #29 | Exceptional $53,457 |
| Cambodians | 100.0 /100 | #30 | Exceptional $53,386 |
| Russians | 100.0 /100 | #31 | Exceptional $53,334 |
| Immigrants | Asia | 100.0 /100 | #32 | Exceptional $53,310 |
| Immigrants | Greece | 100.0 /100 | #33 | Exceptional $53,282 |
| Immigrants | Sri Lanka | 100.0 /100 | #34 | Exceptional $53,268 |