Hispanic or Latino vs Bangladeshi Median Earnings
COMPARE
Hispanic or Latino
Bangladeshi
Median Earnings
Median Earnings Comparison
Hispanics or Latinos
Bangladeshis
$40,288
MEDIAN EARNINGS
0.0/ 100
METRIC RATING
311th/ 347
METRIC RANK
$41,263
MEDIAN EARNINGS
0.1/ 100
METRIC RATING
295th/ 347
METRIC RANK
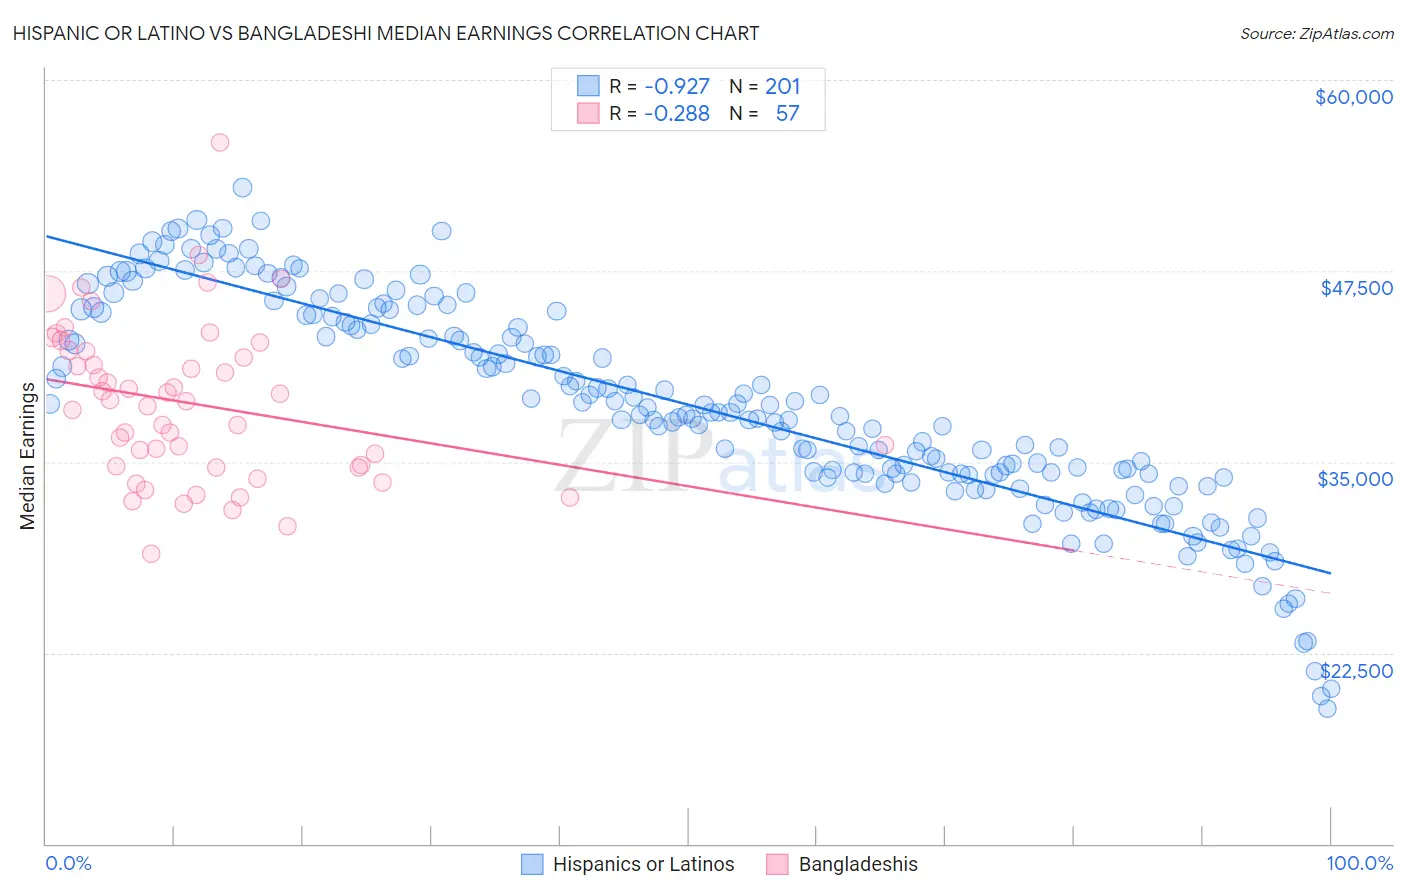
Hispanic or Latino vs Bangladeshi Median Earnings Correlation Chart
The statistical analysis conducted on geographies consisting of 578,075,815 people shows a near-perfect negative correlation between the proportion of Hispanics or Latinos and median earnings in the United States with a correlation coefficient (R) of -0.927 and weighted average of $40,288. Similarly, the statistical analysis conducted on geographies consisting of 141,452,923 people shows a weak negative correlation between the proportion of Bangladeshis and median earnings in the United States with a correlation coefficient (R) of -0.288 and weighted average of $41,263, a difference of 2.4%.
Median Earnings Correlation Summary
| Measurement | Hispanic or Latino | Bangladeshi |
| Minimum | $18,851 | $28,992 |
| Maximum | $52,967 | $55,893 |
| Range | $34,116 | $26,901 |
| Mean | $38,684 | $38,826 |
| Median | $38,266 | $38,964 |
| Interquartile 25% (IQ1) | $34,210 | $34,688 |
| Interquartile 75% (IQ3) | $44,630 | $42,288 |
| Interquartile Range (IQR) | $10,420 | $7,600 |
| Standard Deviation (Sample) | $6,924 | $5,171 |
| Standard Deviation (Population) | $6,907 | $5,125 |
Demographics Similar to Hispanics or Latinos and Bangladeshis by Median Earnings
In terms of median earnings, the demographic groups most similar to Hispanics or Latinos are Chippewa ($40,287, a difference of 0.0%), Choctaw ($40,270, a difference of 0.040%), Apache ($40,388, a difference of 0.25%), Immigrants from Haiti ($40,550, a difference of 0.65%), and Cuban ($40,619, a difference of 0.82%). Similarly, the demographic groups most similar to Bangladeshis are Cherokee ($41,252, a difference of 0.030%), Potawatomi ($41,288, a difference of 0.060%), Guatemalan ($41,205, a difference of 0.14%), Immigrants from Zaire ($41,325, a difference of 0.15%), and Immigrants from Micronesia ($41,133, a difference of 0.32%).
| Demographics | Rating | Rank | Median Earnings |
| Immigrants | Zaire | 0.1 /100 | #293 | Tragic $41,325 |
| Potawatomi | 0.1 /100 | #294 | Tragic $41,288 |
| Bangladeshis | 0.1 /100 | #295 | Tragic $41,263 |
| Cherokee | 0.1 /100 | #296 | Tragic $41,252 |
| Guatemalans | 0.1 /100 | #297 | Tragic $41,205 |
| Immigrants | Micronesia | 0.1 /100 | #298 | Tragic $41,133 |
| Immigrants | Caribbean | 0.1 /100 | #299 | Tragic $41,119 |
| Ute | 0.1 /100 | #300 | Tragic $41,051 |
| Immigrants | Latin America | 0.1 /100 | #301 | Tragic $41,049 |
| Shoshone | 0.0 /100 | #302 | Tragic $40,932 |
| Haitians | 0.0 /100 | #303 | Tragic $40,918 |
| Immigrants | Guatemala | 0.0 /100 | #304 | Tragic $40,851 |
| Chickasaw | 0.0 /100 | #305 | Tragic $40,672 |
| Yaqui | 0.0 /100 | #306 | Tragic $40,647 |
| Hondurans | 0.0 /100 | #307 | Tragic $40,638 |
| Cubans | 0.0 /100 | #308 | Tragic $40,619 |
| Immigrants | Haiti | 0.0 /100 | #309 | Tragic $40,550 |
| Apache | 0.0 /100 | #310 | Tragic $40,388 |
| Hispanics or Latinos | 0.0 /100 | #311 | Tragic $40,288 |
| Chippewa | 0.0 /100 | #312 | Tragic $40,287 |
| Choctaw | 0.0 /100 | #313 | Tragic $40,270 |