Hispanic or Latino vs Immigrants from Congo Unemployment
COMPARE
Hispanic or Latino
Immigrants from Congo
Unemployment
Unemployment Comparison
Hispanics or Latinos
Immigrants from Congo
5.9%
UNEMPLOYMENT
0.0/ 100
METRIC RATING
272nd/ 347
METRIC RANK
5.3%
UNEMPLOYMENT
50.0/ 100
METRIC RATING
174th/ 347
METRIC RANK
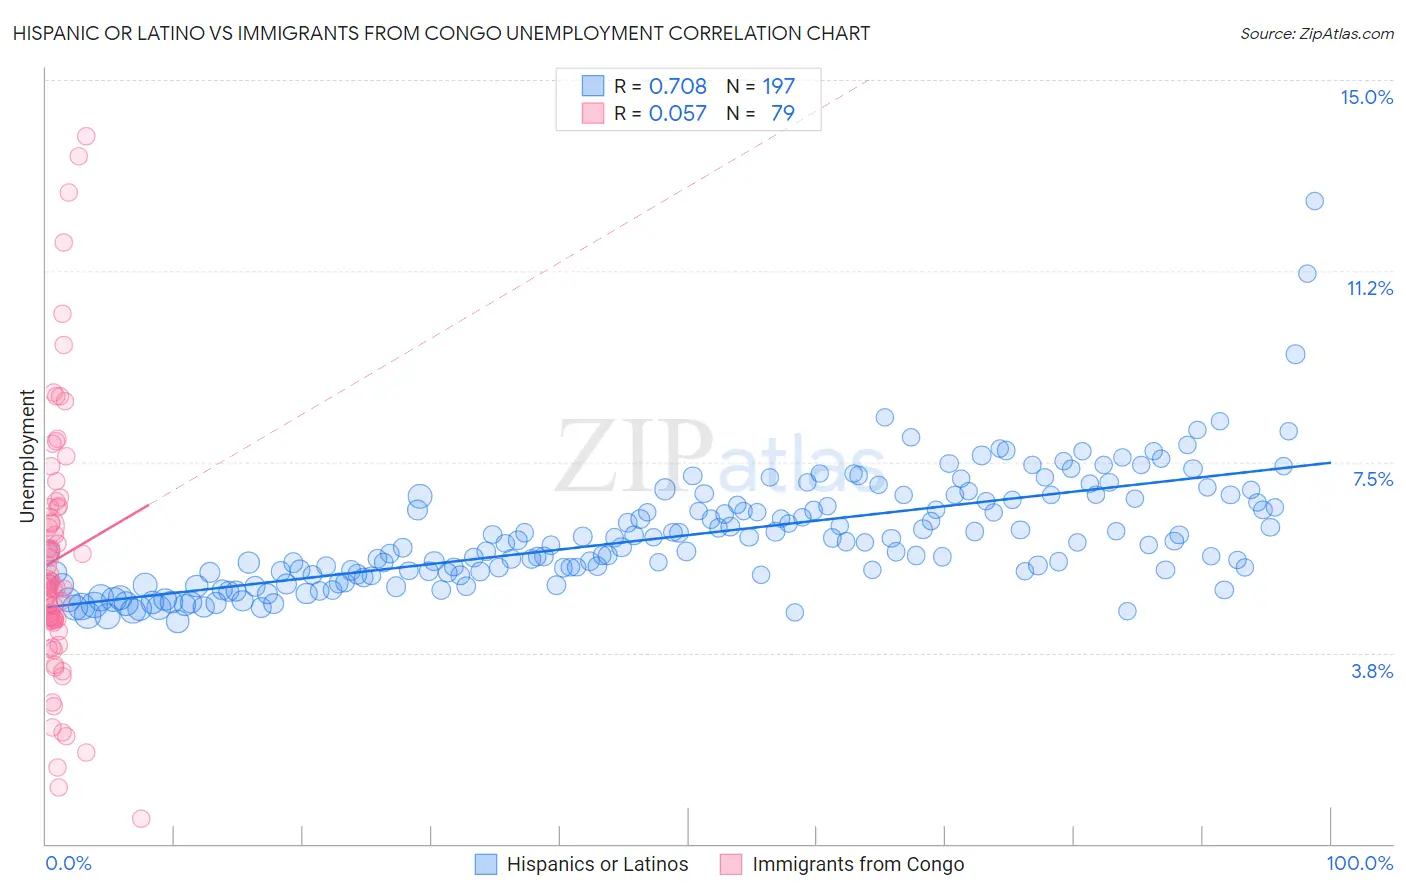
Hispanic or Latino vs Immigrants from Congo Unemployment Correlation Chart
The statistical analysis conducted on geographies consisting of 570,210,949 people shows a strong positive correlation between the proportion of Hispanics or Latinos and unemployment in the United States with a correlation coefficient (R) of 0.708 and weighted average of 5.9%. Similarly, the statistical analysis conducted on geographies consisting of 92,111,963 people shows a slight positive correlation between the proportion of Immigrants from Congo and unemployment in the United States with a correlation coefficient (R) of 0.057 and weighted average of 5.3%, a difference of 12.2%.
Unemployment Correlation Summary
| Measurement | Hispanic or Latino | Immigrants from Congo |
| Minimum | 4.4% | 0.50% |
| Maximum | 12.6% | 13.9% |
| Range | 8.3% | 13.4% |
| Mean | 6.0% | 5.6% |
| Median | 5.9% | 5.1% |
| Interquartile 25% (IQ1) | 5.3% | 4.4% |
| Interquartile 75% (IQ3) | 6.7% | 6.6% |
| Interquartile Range (IQR) | 1.4% | 2.2% |
| Standard Deviation (Sample) | 1.1% | 2.6% |
| Standard Deviation (Population) | 1.1% | 2.6% |
Similar Demographics by Unemployment
Demographics Similar to Hispanics or Latinos by Unemployment
In terms of unemployment, the demographic groups most similar to Hispanics or Latinos are Immigrants from Fiji (5.9%, a difference of 0.17%), Bahamian (5.9%, a difference of 0.46%), Immigrants from Latin America (5.9%, a difference of 0.67%), Mexican (5.9%, a difference of 0.68%), and Blackfeet (5.8%, a difference of 0.92%).
| Demographics | Rating | Rank | Unemployment |
| Nigerians | 0.1 /100 | #265 | Tragic 5.8% |
| Mexican American Indians | 0.1 /100 | #266 | Tragic 5.8% |
| Immigrants | Nigeria | 0.1 /100 | #267 | Tragic 5.8% |
| Immigrants | Sierra Leone | 0.1 /100 | #268 | Tragic 5.8% |
| Immigrants | El Salvador | 0.1 /100 | #269 | Tragic 5.8% |
| Blackfeet | 0.1 /100 | #270 | Tragic 5.8% |
| Mexicans | 0.1 /100 | #271 | Tragic 5.9% |
| Hispanics or Latinos | 0.0 /100 | #272 | Tragic 5.9% |
| Immigrants | Fiji | 0.0 /100 | #273 | Tragic 5.9% |
| Bahamians | 0.0 /100 | #274 | Tragic 5.9% |
| Immigrants | Latin America | 0.0 /100 | #275 | Tragic 5.9% |
| Immigrants | Central America | 0.0 /100 | #276 | Tragic 6.0% |
| Armenians | 0.0 /100 | #277 | Tragic 6.0% |
| Ghanaians | 0.0 /100 | #278 | Tragic 6.0% |
| Immigrants | Mexico | 0.0 /100 | #279 | Tragic 6.0% |
Demographics Similar to Immigrants from Congo by Unemployment
In terms of unemployment, the demographic groups most similar to Immigrants from Congo are Taiwanese (5.3%, a difference of 0.020%), Nicaraguan (5.3%, a difference of 0.080%), Immigrants from Poland (5.3%, a difference of 0.11%), Nonimmigrants (5.3%, a difference of 0.13%), and Immigrants from Vietnam (5.2%, a difference of 0.15%).
| Demographics | Rating | Rank | Unemployment |
| Colombians | 61.1 /100 | #167 | Good 5.2% |
| Uruguayans | 60.2 /100 | #168 | Good 5.2% |
| Immigrants | Morocco | 59.1 /100 | #169 | Average 5.2% |
| Immigrants | Nicaragua | 57.1 /100 | #170 | Average 5.2% |
| Puget Sound Salish | 56.6 /100 | #171 | Average 5.2% |
| Immigrants | Vietnam | 52.5 /100 | #172 | Average 5.2% |
| Immigrants | Poland | 51.8 /100 | #173 | Average 5.3% |
| Immigrants | Congo | 50.0 /100 | #174 | Average 5.3% |
| Taiwanese | 49.6 /100 | #175 | Average 5.3% |
| Nicaraguans | 48.7 /100 | #176 | Average 5.3% |
| Immigrants | Nonimmigrants | 47.9 /100 | #177 | Average 5.3% |
| Afghans | 47.4 /100 | #178 | Average 5.3% |
| Malaysians | 46.8 /100 | #179 | Average 5.3% |
| Immigrants | Greece | 45.0 /100 | #180 | Average 5.3% |
| Albanians | 43.5 /100 | #181 | Average 5.3% |