Hispanic or Latino vs Immigrants from Oceania Median Earnings
COMPARE
Hispanic or Latino
Immigrants from Oceania
Median Earnings
Median Earnings Comparison
Hispanics or Latinos
Immigrants from Oceania
$40,288
MEDIAN EARNINGS
0.0/ 100
METRIC RATING
311th/ 347
METRIC RANK
$47,617
MEDIAN EARNINGS
84.1/ 100
METRIC RATING
151st/ 347
METRIC RANK
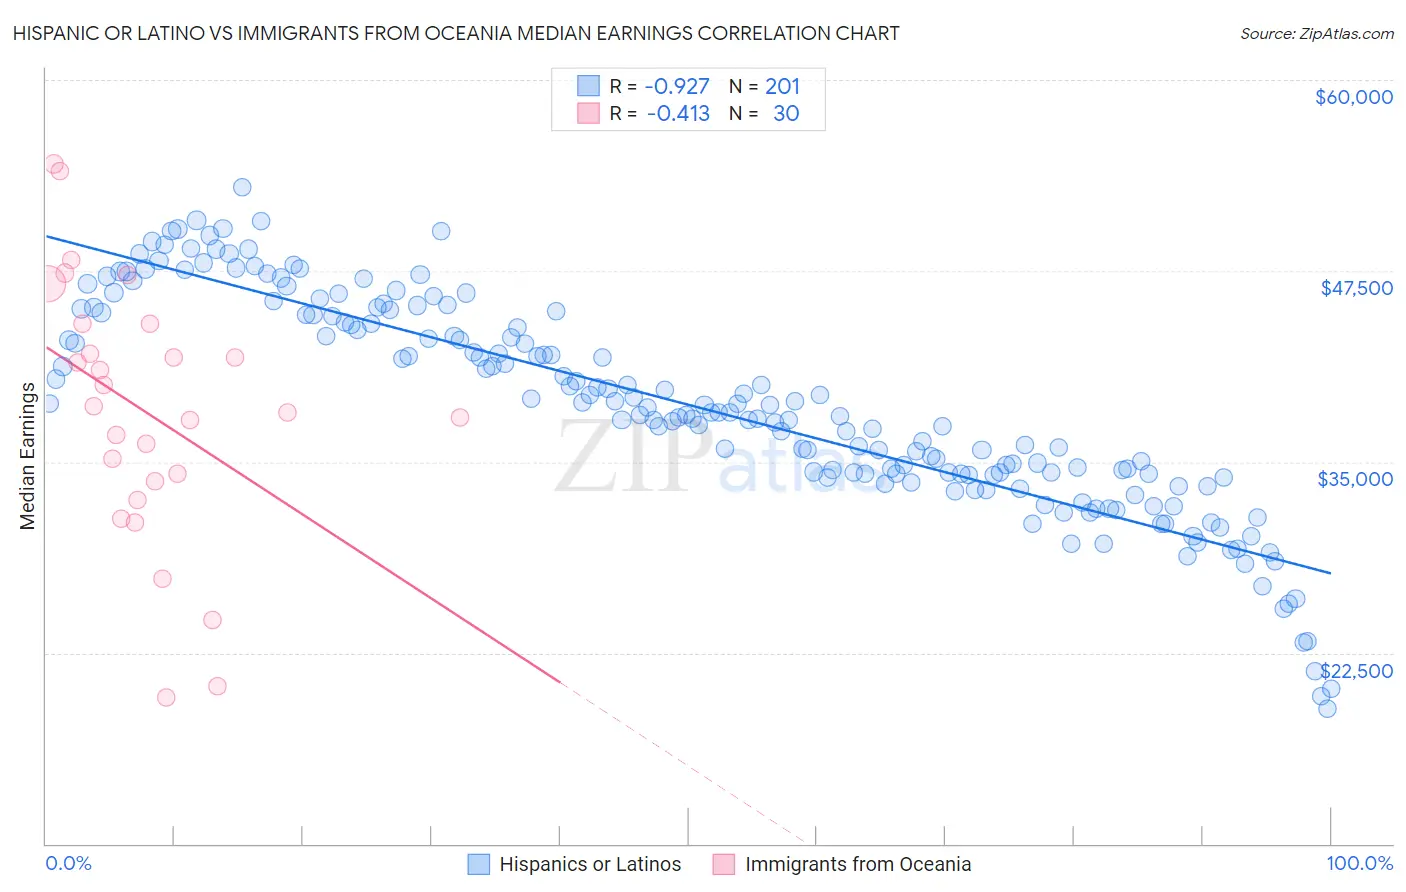
Hispanic or Latino vs Immigrants from Oceania Median Earnings Correlation Chart
The statistical analysis conducted on geographies consisting of 578,075,815 people shows a near-perfect negative correlation between the proportion of Hispanics or Latinos and median earnings in the United States with a correlation coefficient (R) of -0.927 and weighted average of $40,288. Similarly, the statistical analysis conducted on geographies consisting of 305,514,828 people shows a moderate negative correlation between the proportion of Immigrants from Oceania and median earnings in the United States with a correlation coefficient (R) of -0.413 and weighted average of $47,617, a difference of 18.2%.
Median Earnings Correlation Summary
| Measurement | Hispanic or Latino | Immigrants from Oceania |
| Minimum | $18,851 | $19,583 |
| Maximum | $52,967 | $54,486 |
| Range | $34,116 | $34,903 |
| Mean | $38,684 | $38,323 |
| Median | $38,266 | $38,462 |
| Interquartile 25% (IQ1) | $34,210 | $33,709 |
| Interquartile 75% (IQ3) | $44,630 | $44,026 |
| Interquartile Range (IQR) | $10,420 | $10,317 |
| Standard Deviation (Sample) | $6,924 | $8,581 |
| Standard Deviation (Population) | $6,907 | $8,437 |
Similar Demographics by Median Earnings
Demographics Similar to Hispanics or Latinos by Median Earnings
In terms of median earnings, the demographic groups most similar to Hispanics or Latinos are Chippewa ($40,287, a difference of 0.0%), Choctaw ($40,270, a difference of 0.040%), Cheyenne ($40,233, a difference of 0.14%), Seminole ($40,233, a difference of 0.14%), and Immigrants from Honduras ($40,195, a difference of 0.23%).
| Demographics | Rating | Rank | Median Earnings |
| Immigrants | Guatemala | 0.0 /100 | #304 | Tragic $40,851 |
| Chickasaw | 0.0 /100 | #305 | Tragic $40,672 |
| Yaqui | 0.0 /100 | #306 | Tragic $40,647 |
| Hondurans | 0.0 /100 | #307 | Tragic $40,638 |
| Cubans | 0.0 /100 | #308 | Tragic $40,619 |
| Immigrants | Haiti | 0.0 /100 | #309 | Tragic $40,550 |
| Apache | 0.0 /100 | #310 | Tragic $40,388 |
| Hispanics or Latinos | 0.0 /100 | #311 | Tragic $40,288 |
| Chippewa | 0.0 /100 | #312 | Tragic $40,287 |
| Choctaw | 0.0 /100 | #313 | Tragic $40,270 |
| Cheyenne | 0.0 /100 | #314 | Tragic $40,233 |
| Seminole | 0.0 /100 | #315 | Tragic $40,233 |
| Immigrants | Honduras | 0.0 /100 | #316 | Tragic $40,195 |
| Fijians | 0.0 /100 | #317 | Tragic $40,193 |
| Dutch West Indians | 0.0 /100 | #318 | Tragic $40,107 |
Demographics Similar to Immigrants from Oceania by Median Earnings
In terms of median earnings, the demographic groups most similar to Immigrants from Oceania are Peruvian ($47,628, a difference of 0.020%), Luxembourger ($47,640, a difference of 0.050%), Immigrants from Eritrea ($47,657, a difference of 0.080%), Immigrants from South Eastern Asia ($47,671, a difference of 0.11%), and Immigrants from Germany ($47,566, a difference of 0.11%).
| Demographics | Rating | Rank | Median Earnings |
| Hungarians | 87.1 /100 | #144 | Excellent $47,795 |
| Immigrants | Saudi Arabia | 85.6 /100 | #145 | Excellent $47,704 |
| Immigrants | Chile | 85.5 /100 | #146 | Excellent $47,697 |
| Immigrants | South Eastern Asia | 85.0 /100 | #147 | Excellent $47,671 |
| Immigrants | Eritrea | 84.8 /100 | #148 | Excellent $47,657 |
| Luxembourgers | 84.5 /100 | #149 | Excellent $47,640 |
| Peruvians | 84.2 /100 | #150 | Excellent $47,628 |
| Immigrants | Oceania | 84.1 /100 | #151 | Excellent $47,617 |
| Immigrants | Germany | 83.1 /100 | #152 | Excellent $47,566 |
| Slavs | 81.1 /100 | #153 | Excellent $47,470 |
| Immigrants | Portugal | 77.3 /100 | #154 | Good $47,304 |
| Immigrants | Vietnam | 76.7 /100 | #155 | Good $47,282 |
| Irish | 76.6 /100 | #156 | Good $47,276 |
| Czechs | 75.1 /100 | #157 | Good $47,221 |
| Slovaks | 71.7 /100 | #158 | Good $47,095 |