Immigrants from Indonesia vs Immigrants from Congo Median Earnings
COMPARE
Immigrants from Indonesia
Immigrants from Congo
Median Earnings
Median Earnings Comparison
Immigrants from Indonesia
Immigrants from Congo
$51,715
MEDIAN EARNINGS
99.9/ 100
METRIC RATING
54th/ 347
METRIC RANK
$39,169
MEDIAN EARNINGS
0.0/ 100
METRIC RATING
330th/ 347
METRIC RANK
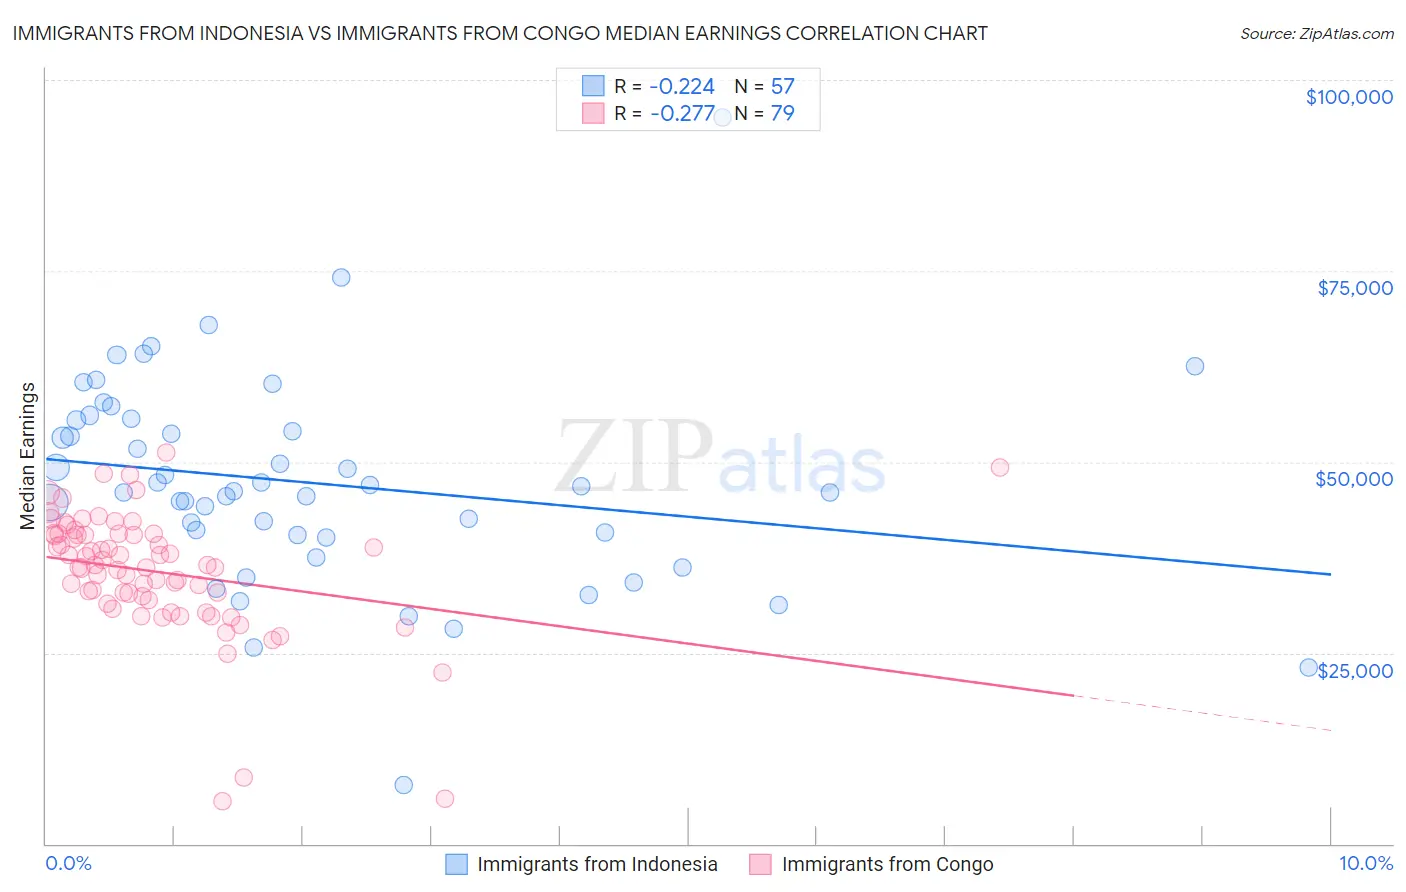
Immigrants from Indonesia vs Immigrants from Congo Median Earnings Correlation Chart
The statistical analysis conducted on geographies consisting of 215,769,238 people shows a weak negative correlation between the proportion of Immigrants from Indonesia and median earnings in the United States with a correlation coefficient (R) of -0.224 and weighted average of $51,715. Similarly, the statistical analysis conducted on geographies consisting of 92,120,169 people shows a weak negative correlation between the proportion of Immigrants from Congo and median earnings in the United States with a correlation coefficient (R) of -0.277 and weighted average of $39,169, a difference of 32.0%.
Median Earnings Correlation Summary
| Measurement | Immigrants from Indonesia | Immigrants from Congo |
| Minimum | $7,703 | $5,625 |
| Maximum | $95,117 | $51,158 |
| Range | $87,414 | $45,533 |
| Mean | $47,201 | $35,599 |
| Median | $46,101 | $36,543 |
| Interquartile 25% (IQ1) | $40,269 | $31,963 |
| Interquartile 75% (IQ3) | $55,574 | $40,520 |
| Interquartile Range (IQR) | $15,305 | $8,557 |
| Standard Deviation (Sample) | $13,842 | $8,202 |
| Standard Deviation (Population) | $13,720 | $8,150 |
Similar Demographics by Median Earnings
Demographics Similar to Immigrants from Indonesia by Median Earnings
In terms of median earnings, the demographic groups most similar to Immigrants from Indonesia are Egyptian ($51,701, a difference of 0.030%), Immigrants from Pakistan ($51,693, a difference of 0.040%), Immigrants from Norway ($51,758, a difference of 0.080%), Estonian ($51,772, a difference of 0.11%), and Immigrants from Eastern Europe ($51,624, a difference of 0.18%).
| Demographics | Rating | Rank | Median Earnings |
| Australians | 100.0 /100 | #47 | Exceptional $52,294 |
| Immigrants | Europe | 100.0 /100 | #48 | Exceptional $52,195 |
| Bolivians | 100.0 /100 | #49 | Exceptional $52,005 |
| Immigrants | South Africa | 100.0 /100 | #50 | Exceptional $51,850 |
| Immigrants | Austria | 99.9 /100 | #51 | Exceptional $51,826 |
| Estonians | 99.9 /100 | #52 | Exceptional $51,772 |
| Immigrants | Norway | 99.9 /100 | #53 | Exceptional $51,758 |
| Immigrants | Indonesia | 99.9 /100 | #54 | Exceptional $51,715 |
| Egyptians | 99.9 /100 | #55 | Exceptional $51,701 |
| Immigrants | Pakistan | 99.9 /100 | #56 | Exceptional $51,693 |
| Immigrants | Eastern Europe | 99.9 /100 | #57 | Exceptional $51,624 |
| Immigrants | Bolivia | 99.9 /100 | #58 | Exceptional $51,605 |
| Immigrants | Croatia | 99.9 /100 | #59 | Exceptional $51,581 |
| Immigrants | Serbia | 99.9 /100 | #60 | Exceptional $51,557 |
| Immigrants | Latvia | 99.9 /100 | #61 | Exceptional $51,555 |
Demographics Similar to Immigrants from Congo by Median Earnings
In terms of median earnings, the demographic groups most similar to Immigrants from Congo are Immigrants from Mexico ($39,114, a difference of 0.14%), Kiowa ($39,232, a difference of 0.16%), Yakama ($39,107, a difference of 0.16%), Houma ($38,949, a difference of 0.57%), and Spanish American Indian ($38,907, a difference of 0.67%).
| Demographics | Rating | Rank | Median Earnings |
| Bahamians | 0.0 /100 | #323 | Tragic $39,735 |
| Ottawa | 0.0 /100 | #324 | Tragic $39,721 |
| Creek | 0.0 /100 | #325 | Tragic $39,648 |
| Immigrants | Yemen | 0.0 /100 | #326 | Tragic $39,540 |
| Yuman | 0.0 /100 | #327 | Tragic $39,523 |
| Sioux | 0.0 /100 | #328 | Tragic $39,448 |
| Kiowa | 0.0 /100 | #329 | Tragic $39,232 |
| Immigrants | Congo | 0.0 /100 | #330 | Tragic $39,169 |
| Immigrants | Mexico | 0.0 /100 | #331 | Tragic $39,114 |
| Yakama | 0.0 /100 | #332 | Tragic $39,107 |
| Houma | 0.0 /100 | #333 | Tragic $38,949 |
| Spanish American Indians | 0.0 /100 | #334 | Tragic $38,907 |
| Natives/Alaskans | 0.0 /100 | #335 | Tragic $38,896 |
| Crow | 0.0 /100 | #336 | Tragic $38,707 |
| Immigrants | Cuba | 0.0 /100 | #337 | Tragic $38,426 |