Hispanic or Latino vs Immigrants from Guyana Median Earnings
COMPARE
Hispanic or Latino
Immigrants from Guyana
Median Earnings
Median Earnings Comparison
Hispanics or Latinos
Immigrants from Guyana
$40,288
MEDIAN EARNINGS
0.0/ 100
METRIC RATING
311th/ 347
METRIC RANK
$45,204
MEDIAN EARNINGS
15.1/ 100
METRIC RATING
221st/ 347
METRIC RANK
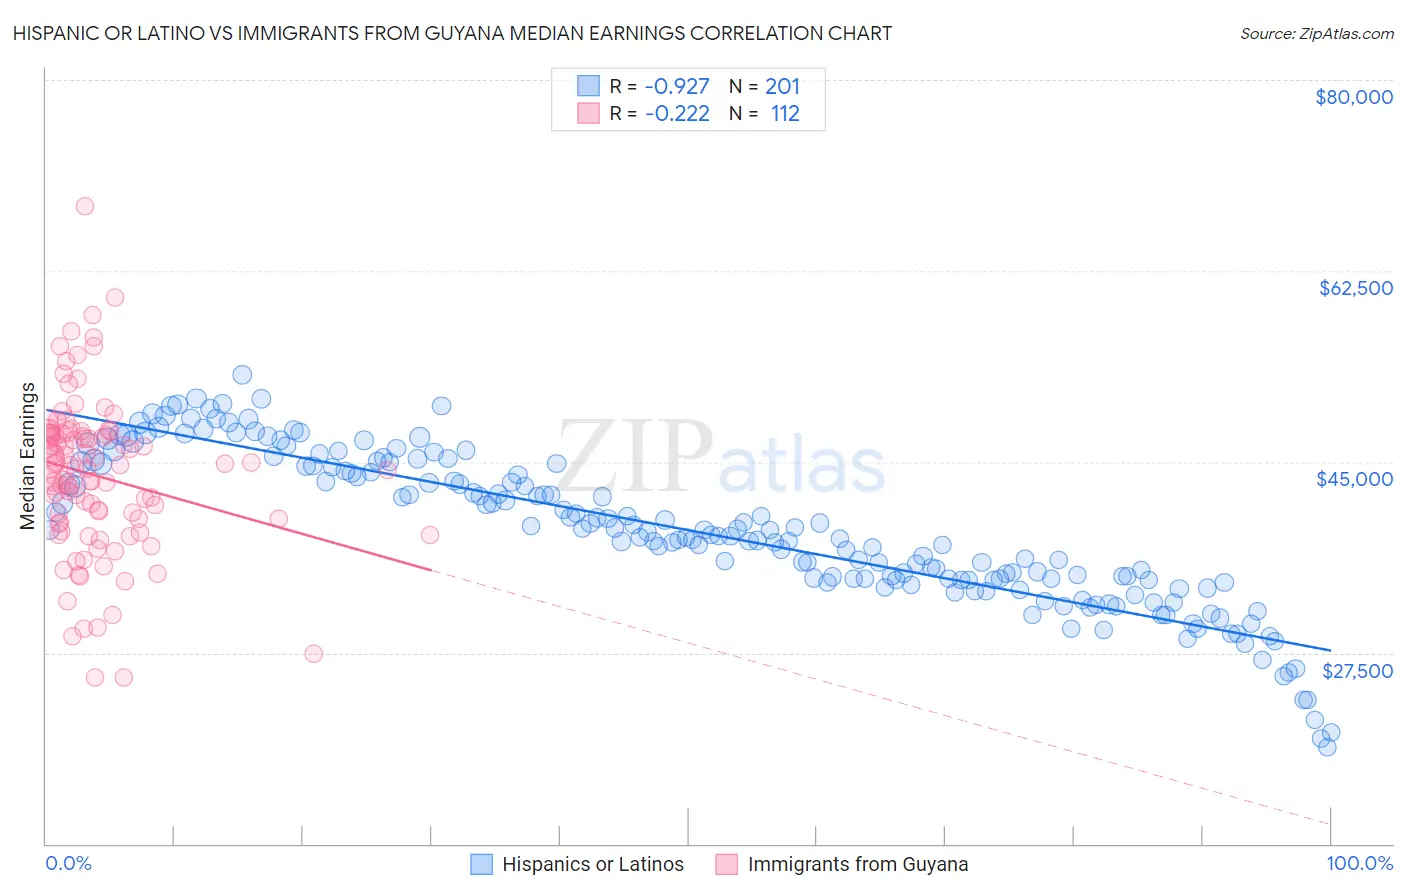
Hispanic or Latino vs Immigrants from Guyana Median Earnings Correlation Chart
The statistical analysis conducted on geographies consisting of 578,075,815 people shows a near-perfect negative correlation between the proportion of Hispanics or Latinos and median earnings in the United States with a correlation coefficient (R) of -0.927 and weighted average of $40,288. Similarly, the statistical analysis conducted on geographies consisting of 183,726,948 people shows a weak negative correlation between the proportion of Immigrants from Guyana and median earnings in the United States with a correlation coefficient (R) of -0.222 and weighted average of $45,204, a difference of 12.2%.
Median Earnings Correlation Summary
| Measurement | Hispanic or Latino | Immigrants from Guyana |
| Minimum | $18,851 | $25,266 |
| Maximum | $52,967 | $68,439 |
| Range | $34,116 | $43,174 |
| Mean | $38,684 | $43,730 |
| Median | $38,266 | $44,540 |
| Interquartile 25% (IQ1) | $34,210 | $39,599 |
| Interquartile 75% (IQ3) | $44,630 | $47,563 |
| Interquartile Range (IQR) | $10,420 | $7,964 |
| Standard Deviation (Sample) | $6,924 | $7,179 |
| Standard Deviation (Population) | $6,907 | $7,147 |
Similar Demographics by Median Earnings
Demographics Similar to Hispanics or Latinos by Median Earnings
In terms of median earnings, the demographic groups most similar to Hispanics or Latinos are Chippewa ($40,287, a difference of 0.0%), Choctaw ($40,270, a difference of 0.040%), Cheyenne ($40,233, a difference of 0.14%), Seminole ($40,233, a difference of 0.14%), and Immigrants from Honduras ($40,195, a difference of 0.23%).
| Demographics | Rating | Rank | Median Earnings |
| Immigrants | Guatemala | 0.0 /100 | #304 | Tragic $40,851 |
| Chickasaw | 0.0 /100 | #305 | Tragic $40,672 |
| Yaqui | 0.0 /100 | #306 | Tragic $40,647 |
| Hondurans | 0.0 /100 | #307 | Tragic $40,638 |
| Cubans | 0.0 /100 | #308 | Tragic $40,619 |
| Immigrants | Haiti | 0.0 /100 | #309 | Tragic $40,550 |
| Apache | 0.0 /100 | #310 | Tragic $40,388 |
| Hispanics or Latinos | 0.0 /100 | #311 | Tragic $40,288 |
| Chippewa | 0.0 /100 | #312 | Tragic $40,287 |
| Choctaw | 0.0 /100 | #313 | Tragic $40,270 |
| Cheyenne | 0.0 /100 | #314 | Tragic $40,233 |
| Seminole | 0.0 /100 | #315 | Tragic $40,233 |
| Immigrants | Honduras | 0.0 /100 | #316 | Tragic $40,195 |
| Fijians | 0.0 /100 | #317 | Tragic $40,193 |
| Dutch West Indians | 0.0 /100 | #318 | Tragic $40,107 |
Demographics Similar to Immigrants from Guyana by Median Earnings
In terms of median earnings, the demographic groups most similar to Immigrants from Guyana are Immigrants from Panama ($45,198, a difference of 0.010%), Ecuadorian ($45,214, a difference of 0.020%), White/Caucasian ($45,197, a difference of 0.020%), West Indian ($45,132, a difference of 0.16%), and Immigrants from Cambodia ($45,090, a difference of 0.25%).
| Demographics | Rating | Rank | Median Earnings |
| Nigerians | 22.0 /100 | #214 | Fair $45,532 |
| Immigrants | Bangladesh | 22.0 /100 | #215 | Fair $45,532 |
| Guyanese | 20.6 /100 | #216 | Fair $45,470 |
| Tlingit-Haida | 20.5 /100 | #217 | Fair $45,468 |
| Spanish | 19.7 /100 | #218 | Poor $45,432 |
| Dutch | 18.4 /100 | #219 | Poor $45,370 |
| Ecuadorians | 15.3 /100 | #220 | Poor $45,214 |
| Immigrants | Guyana | 15.1 /100 | #221 | Poor $45,204 |
| Immigrants | Panama | 15.0 /100 | #222 | Poor $45,198 |
| Whites/Caucasians | 15.0 /100 | #223 | Poor $45,197 |
| West Indians | 13.9 /100 | #224 | Poor $45,132 |
| Immigrants | Cambodia | 13.2 /100 | #225 | Poor $45,090 |
| Immigrants | Nigeria | 12.2 /100 | #226 | Poor $45,030 |
| Native Hawaiians | 12.2 /100 | #227 | Poor $45,027 |
| Immigrants | Iraq | 11.6 /100 | #228 | Poor $44,988 |