Hispanic or Latino vs Immigrants from Morocco Median Earnings
COMPARE
Hispanic or Latino
Immigrants from Morocco
Median Earnings
Median Earnings Comparison
Hispanics or Latinos
Immigrants from Morocco
$40,288
MEDIAN EARNINGS
0.0/ 100
METRIC RATING
311th/ 347
METRIC RANK
$49,368
MEDIAN EARNINGS
98.4/ 100
METRIC RATING
107th/ 347
METRIC RANK
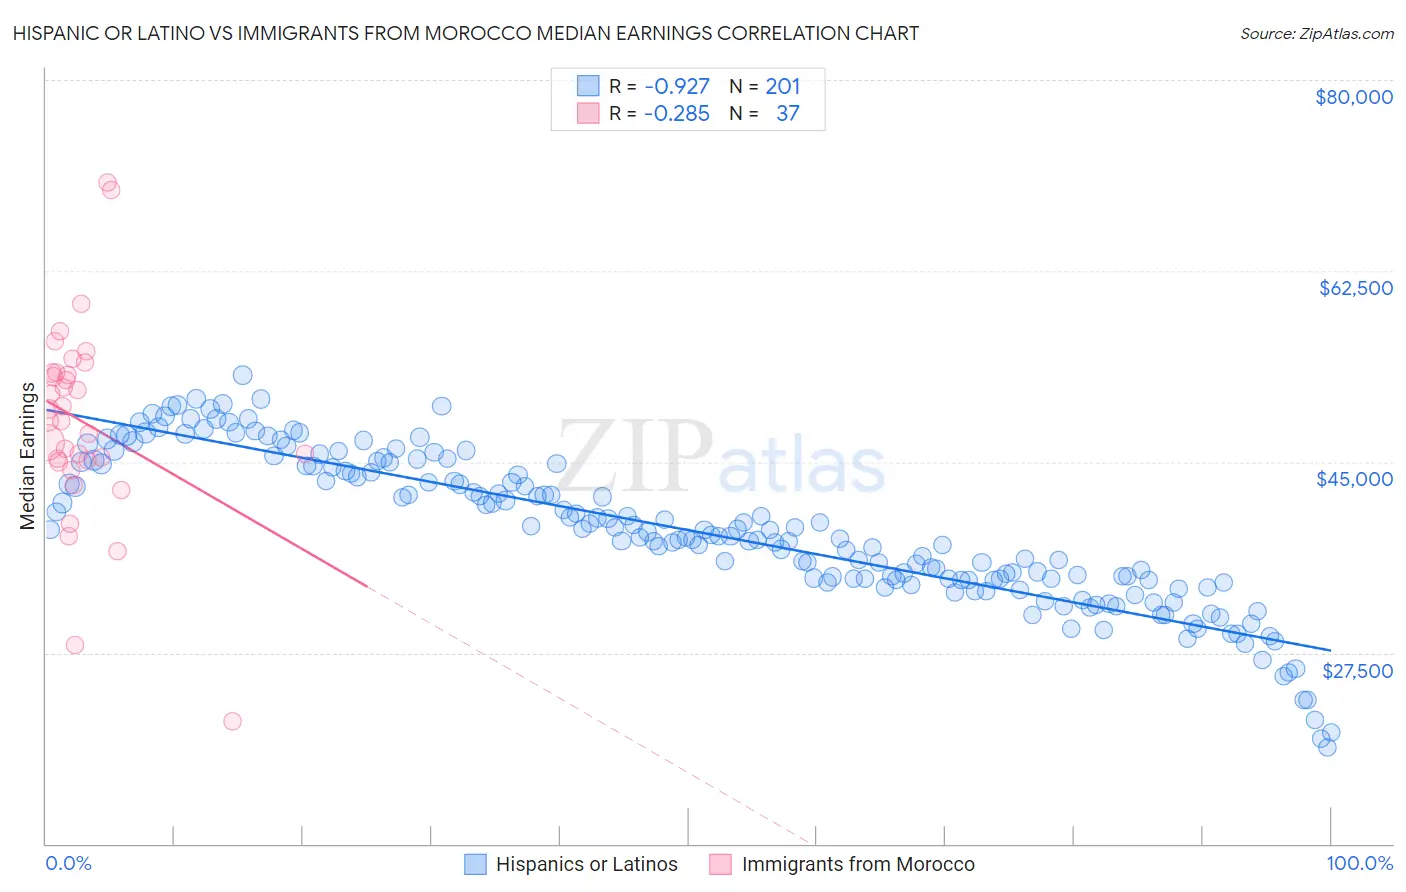
Hispanic or Latino vs Immigrants from Morocco Median Earnings Correlation Chart
The statistical analysis conducted on geographies consisting of 578,075,815 people shows a near-perfect negative correlation between the proportion of Hispanics or Latinos and median earnings in the United States with a correlation coefficient (R) of -0.927 and weighted average of $40,288. Similarly, the statistical analysis conducted on geographies consisting of 178,911,278 people shows a weak negative correlation between the proportion of Immigrants from Morocco and median earnings in the United States with a correlation coefficient (R) of -0.285 and weighted average of $49,368, a difference of 22.5%.
Median Earnings Correlation Summary
| Measurement | Hispanic or Latino | Immigrants from Morocco |
| Minimum | $18,851 | $21,250 |
| Maximum | $52,967 | $70,625 |
| Range | $34,116 | $49,375 |
| Mean | $38,684 | $48,644 |
| Median | $38,266 | $48,771 |
| Interquartile 25% (IQ1) | $34,210 | $45,090 |
| Interquartile 75% (IQ3) | $44,630 | $53,191 |
| Interquartile Range (IQR) | $10,420 | $8,101 |
| Standard Deviation (Sample) | $6,924 | $9,241 |
| Standard Deviation (Population) | $6,907 | $9,116 |
Similar Demographics by Median Earnings
Demographics Similar to Hispanics or Latinos by Median Earnings
In terms of median earnings, the demographic groups most similar to Hispanics or Latinos are Chippewa ($40,287, a difference of 0.0%), Choctaw ($40,270, a difference of 0.040%), Cheyenne ($40,233, a difference of 0.14%), Seminole ($40,233, a difference of 0.14%), and Immigrants from Honduras ($40,195, a difference of 0.23%).
| Demographics | Rating | Rank | Median Earnings |
| Immigrants | Guatemala | 0.0 /100 | #304 | Tragic $40,851 |
| Chickasaw | 0.0 /100 | #305 | Tragic $40,672 |
| Yaqui | 0.0 /100 | #306 | Tragic $40,647 |
| Hondurans | 0.0 /100 | #307 | Tragic $40,638 |
| Cubans | 0.0 /100 | #308 | Tragic $40,619 |
| Immigrants | Haiti | 0.0 /100 | #309 | Tragic $40,550 |
| Apache | 0.0 /100 | #310 | Tragic $40,388 |
| Hispanics or Latinos | 0.0 /100 | #311 | Tragic $40,288 |
| Chippewa | 0.0 /100 | #312 | Tragic $40,287 |
| Choctaw | 0.0 /100 | #313 | Tragic $40,270 |
| Cheyenne | 0.0 /100 | #314 | Tragic $40,233 |
| Seminole | 0.0 /100 | #315 | Tragic $40,233 |
| Immigrants | Honduras | 0.0 /100 | #316 | Tragic $40,195 |
| Fijians | 0.0 /100 | #317 | Tragic $40,193 |
| Dutch West Indians | 0.0 /100 | #318 | Tragic $40,107 |
Demographics Similar to Immigrants from Morocco by Median Earnings
In terms of median earnings, the demographic groups most similar to Immigrants from Morocco are Immigrants from Albania ($49,377, a difference of 0.020%), Immigrants from Western Asia ($49,389, a difference of 0.040%), Immigrants from Brazil ($49,463, a difference of 0.19%), Austrian ($49,501, a difference of 0.27%), and Palestinian ($49,209, a difference of 0.32%).
| Demographics | Rating | Rank | Median Earnings |
| Immigrants | Poland | 98.9 /100 | #100 | Exceptional $49,633 |
| Jordanians | 98.9 /100 | #101 | Exceptional $49,632 |
| Ethiopians | 98.8 /100 | #102 | Exceptional $49,572 |
| Austrians | 98.7 /100 | #103 | Exceptional $49,501 |
| Immigrants | Brazil | 98.6 /100 | #104 | Exceptional $49,463 |
| Immigrants | Western Asia | 98.4 /100 | #105 | Exceptional $49,389 |
| Immigrants | Albania | 98.4 /100 | #106 | Exceptional $49,377 |
| Immigrants | Morocco | 98.4 /100 | #107 | Exceptional $49,368 |
| Palestinians | 98.0 /100 | #108 | Exceptional $49,209 |
| Syrians | 97.1 /100 | #109 | Exceptional $48,934 |
| Immigrants | Ethiopia | 97.1 /100 | #110 | Exceptional $48,924 |
| Immigrants | Zimbabwe | 97.0 /100 | #111 | Exceptional $48,913 |
| Northern Europeans | 96.9 /100 | #112 | Exceptional $48,887 |
| Immigrants | Kuwait | 96.8 /100 | #113 | Exceptional $48,861 |
| Moroccans | 96.7 /100 | #114 | Exceptional $48,838 |